|

Silver Price Forecast: XAG/USD declines sharply from $31.50 amid caution ahead of US NFP

  • Silver price falls vertically to $30.50 after steady PBoC’s Gold reserves data.
  • Investors should brace for more volatility ahead of the US NFP report for May.
  • Growing speculation for Fed rate cuts in September has limited the US Dollar’s upside.

Silver price (XAG/USD) drops sharply to $30.50 in Friday’s European session. The white metal weakens due to multiple headwinds such as caution among investors ahead of the United States (US) Nonfarm Payrolls (NFP) data for May and unchanged China’s Gold reserves by May end from April.

The US NFP report will indicate labor market’s health of world’s largest nation, which will influence the Federal Reserve’s (Fed) interest rate outlook ahead of the policy meeting on Wednesday. According to the estimates, US employers added 185K payrolls, increased from 175K in April. Average Hourly Earnings, which is a measure of wage inflation grew by 0.3% in month from the 0.2% pace recorded for April. Annually, the wage inflation measure is estimated to have grown steadily by 3.9%.

Signs of strengthening labor market conditions would force traders to pare bets supporting rate cuts by the Fed in September, while soft figures will do the opposite.

The US Dollar Index (DXY) remains sideways around the crucial support of 104.00. This week, the USD Index remains on the backfoot as weak employment-oriented economic indicators boost expectations for Fed rate cuts in September.

Meanwhile, non-yielding assets have also come under pressure as an 18-month-long Gold buying spell by the People’s Bank of China (PBoC) appears to be concluded. The PBoC gold reserves by May end were steady at 72.80 million fine troy oz as seen in April’s report. High investment in non-yielding assets is considered optimal amid high inflation and economic uncertainty.

Silver technical analysis

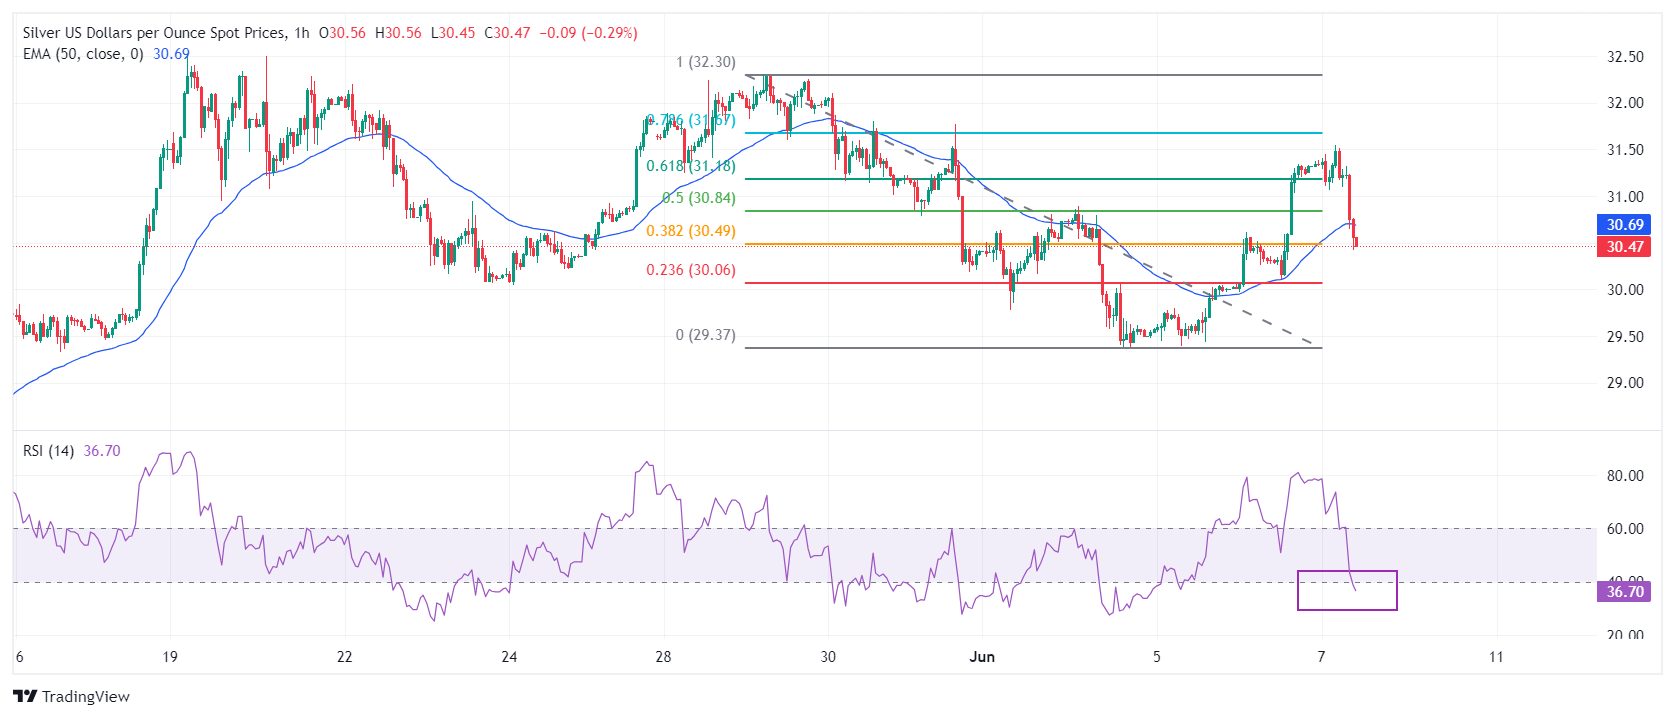
Silver price declines after facing immense selling pressure above the 61.8% Fibonacci retracement (plotted from May 29 high at $32.30 to June 4 low near $29.40) at $31.20. Silver’s near-term outlook appears to be uncertain as spot prices have dropped below the 50-period Exponential Moving Average (EMA), which trades around $30.70.

The 14-period Relative Strength Index (RSI) has slipped below 40.00. A sustained move below the same will push the momentum towards the downside.

Silver hourly chart

XAG/USD

Overview
Today last price30.5
Today Daily Change-0.82
Today Daily Change %-2.62
Today daily open31.32
 
Trends
Daily SMA2030.49
Daily SMA5028.6
Daily SMA10025.99
Daily SMA20024.61
 
Levels
Previous Daily High31.35
Previous Daily Low29.97
Previous Weekly High32.3
Previous Weekly Low30.19
Previous Monthly High32.51
Previous Monthly Low26.02
Daily Fibonacci 38.2%30.82
Daily Fibonacci 61.8%30.5
Daily Pivot Point S130.41
Daily Pivot Point S229.5
Daily Pivot Point S329.04
Daily Pivot Point R131.78
Daily Pivot Point R232.25
Daily Pivot Point R333.16

Author

Sagar Dua

Sagar Dua

FXStreet

Sagar Dua is associated with the financial markets from his college days. Along with pursuing post-graduation in Commerce in 2014, he started his markets training with chart analysis.

More from Sagar Dua
Share:

Editor's Picks

AUD/USD eyes 0.7150 barrier nine-day EMA

AUD/USD inches higher after registering modest losses in the previous day, trading around 0.7130 during the Asian hours. The technical analysis of the daily chart indicates that the pair is moving sideways within the rectangle pattern, suggesting a consolidation as neither the bulls nor the bears have enough momentum to take control of the market.

USD/JPY trades below 160.00 intervention threshold; bullish bias intact

The USD/JPY pair attracts some sellers during the Asian session amid fears that authorities will step in again to prop up the Japanese Yen. Furthermore, the Israel-Lebanon truce prompts some profit-taking around the US Dollar and exerts downward pressure on the currency pair.

Gold puts its 200-day SMA to the test near $4,420

Gold keeps the bullish stance in place in the latter part of Thursday’s session, although a convincing break above the key $4,500 mark per troy ounce still remains elusive. The precious metal’s advance comes amid the resurgence of some selling interest around the Greenback, improving risk sentiment, and declining US Treasury yields across the board.

Bitcoin’s massive storm is back: Why the sell-off is far from over

Bitcoin price action over the last few weeks has felt less like a normal, healthy correction and more like a slow grinding crash that continues to wreak havoc on holdings and trading accounts. And everything suggests that the dramatic crash isn’t over.

Nonfarm payrolls: Testing the limits of Fed policy patience

The upcoming nonfarm payrolls report for May will provide the final update on the US labor market before Kevin Warsh attends his first policy meeting as the new Fed Chair later this month.

Recession on paper: What really moves the Canadian Loonie now?

Statistics Canada handed the headline writers a gift and the analysts a headache. Real GDP shrank 0.1% on an annualized basis in the first quarter, and with the fourth quarter of 2025 revised down to a 1.0% contraction, that is two negative quarters in a row, the textbook definition of a technical recession and Canada's first since the pandemic.