Silver Price Forecast: XAG/USD corrects below $34.50 as US Yields surge
- Silver price faces selling pressure as US bond yields rise sharply.
- Middle East tensions and US political uncertainty will limit the downside in the Silver price.
- Trump’s victory could weigh on exports of US close trading partners.

Silver price (XAG/USD) corrects sharply below $34.50 in Wednesday’s New York session after registering a fresh more than 12-year high slightly below $35.00 on Tuesday. The rally in the white metal appears to have paused for a while as the US Treasury yields have extended its upside.
10-year US Treasury yields jump to near 4.24% as investors expect the Federal Reserve (Fed) to follow a gradual policy-easing cycle. Historically, higher yields on interest-bearing assets increase the opportunity cost of holding an investment in non-yielding assets, such as Silver. The US Dollar (USD), which tracks the Greenback’s value against six major currencies, revisits the August high of 104.45.
However, the upside trend remains intact due to multiple catalysts. From growing United States (US) political uncertainty to escalating Middle East tensions, every catalyst is acting as a tailwind for the Silver price.
According to the Reuters/Ipsos polls, current Vice President Kamala Harris leads by a slight margin against former President Donald Trump. However, market participants worry that Trump’s victory could result in higher tariffs and lower taxes, which could force the Federal Reserve (Fed) to return to the restrictive policy stance for a period of time.
In the Middle East region, the launch of a rocket salvo by Iran-backed-Hezbollah on Israel’s military base near Tel Aviv exhibits signs that tensions between them will stay afloat. The appeal of precious metals, such as Silver, as a safe haven, given that investors consider them as a hedge against dismal market sentiment.
Silver technical analysis
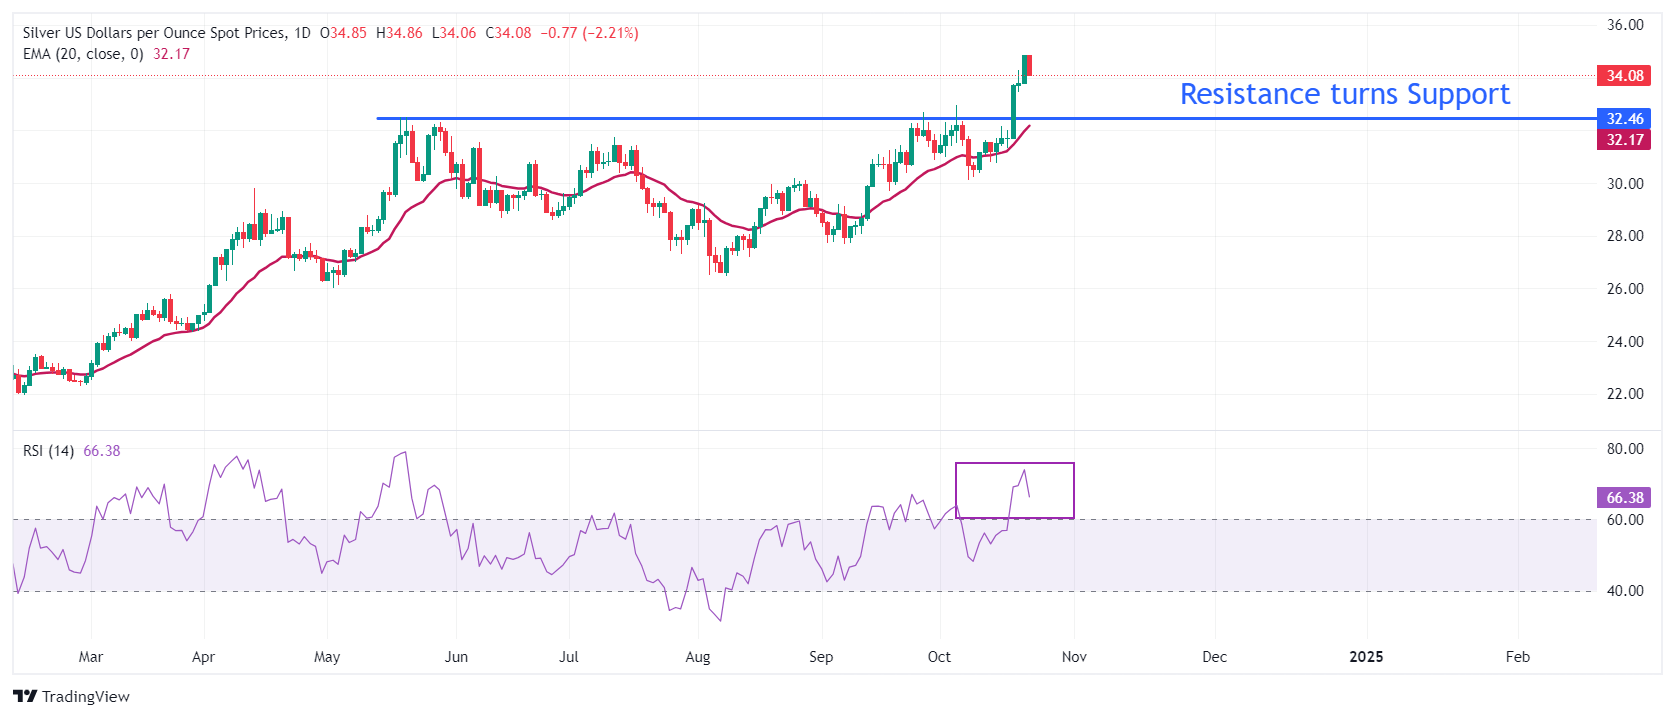
Silver price slumps after failing to capture the key resistance of $35.00. The white metal strengthened after breaking above the horizontal resistance plotted from the May 21 high of $32.50 on a daily timeframe, which will act as a support for now. Upward-sloping 20-day Exponential Moving Averages (EMAs) near $32.15 signal more upside ahead.
The 14-day Relative Strength Index (RSI) oscillates above 60.00, points to an active bullish momentum.
Silver daily chart
Silver FAQs
Silver is a precious metal highly traded among investors. It has been historically used as a store of value and a medium of exchange. Although less popular than Gold, traders may turn to Silver to diversify their investment portfolio, for its intrinsic value or as a potential hedge during high-inflation periods. Investors can buy physical Silver, in coins or in bars, or trade it through vehicles such as Exchange Traded Funds, which track its price on international markets.
Silver prices can move due to a wide range of factors. Geopolitical instability or fears of a deep recession can make Silver price escalate due to its safe-haven status, although to a lesser extent than Gold's. As a yieldless asset, Silver tends to rise with lower interest rates. Its moves also depend on how the US Dollar (USD) behaves as the asset is priced in dollars (XAG/USD). A strong Dollar tends to keep the price of Silver at bay, whereas a weaker Dollar is likely to propel prices up. Other factors such as investment demand, mining supply – Silver is much more abundant than Gold – and recycling rates can also affect prices.
Silver is widely used in industry, particularly in sectors such as electronics or solar energy, as it has one of the highest electric conductivity of all metals – more than Copper and Gold. A surge in demand can increase prices, while a decline tends to lower them. Dynamics in the US, Chinese and Indian economies can also contribute to price swings: for the US and particularly China, their big industrial sectors use Silver in various processes; in India, consumers’ demand for the precious metal for jewellery also plays a key role in setting prices.
Silver prices tend to follow Gold's moves. When Gold prices rise, Silver typically follows suit, as their status as safe-haven assets is similar. The Gold/Silver ratio, which shows the number of ounces of Silver needed to equal the value of one ounce of Gold, may help to determine the relative valuation between both metals. Some investors may consider a high ratio as an indicator that Silver is undervalued, or Gold is overvalued. On the contrary, a low ratio might suggest that Gold is undervalued relative to Silver.
Author

Sagar Dua
FXStreet
Sagar Dua is associated with the financial markets from his college days. Along with pursuing post-graduation in Commerce in 2014, he started his markets training with chart analysis.