Silver Price Forecast: XAG/USD bounces back above $29 with US Inflation under spotlight
- Silver price rebounds strongly from $28.60 as the US Dollar corrects.
- US price pressures are expected to have slowed in May.
- Fed Bowman sees no rate cuts this year.

Silver price (XAG/USD) recovers sharply from a six-week low of $28.60 in Thursday’s New York session. The white metal rises to near $29.20 as the US Dollar (USD) extends its correction amid caution ahead of the United States (US) core Personal Consumption Expenditure Price Index (PCE) data for May, which will be published on Friday.
The US PCE report is expected to show that core price pressures grew at a slower pace of 0.1% against 0.2% in April month-on-month. Annually, the underlying inflation is projected to have decelerated to 2.6% from 2.8% in April.
The scenario in which price pressures decline, as expected or more than that, would boost expectations of early rate cuts by the Fed. Currently, financial markets expect that the Fed will start reducing interest rates from the September meeting and will deliver subsequent rate cuts in the November or December meeting. On the contrary, hot inflation reading would be favorable for the US Dollar and bond yields.
Meanwhile, Fed policymakers continue to argue in favor of maintaining interest rates at their current levels to bring down inflation to 2%. On Wednesday, Fed Governor Michelle Bowman pushed back rate-cut prospects and warned of more rate hikes if disinflation inflation appears to be stalling or reversing.
Silver technical analysis
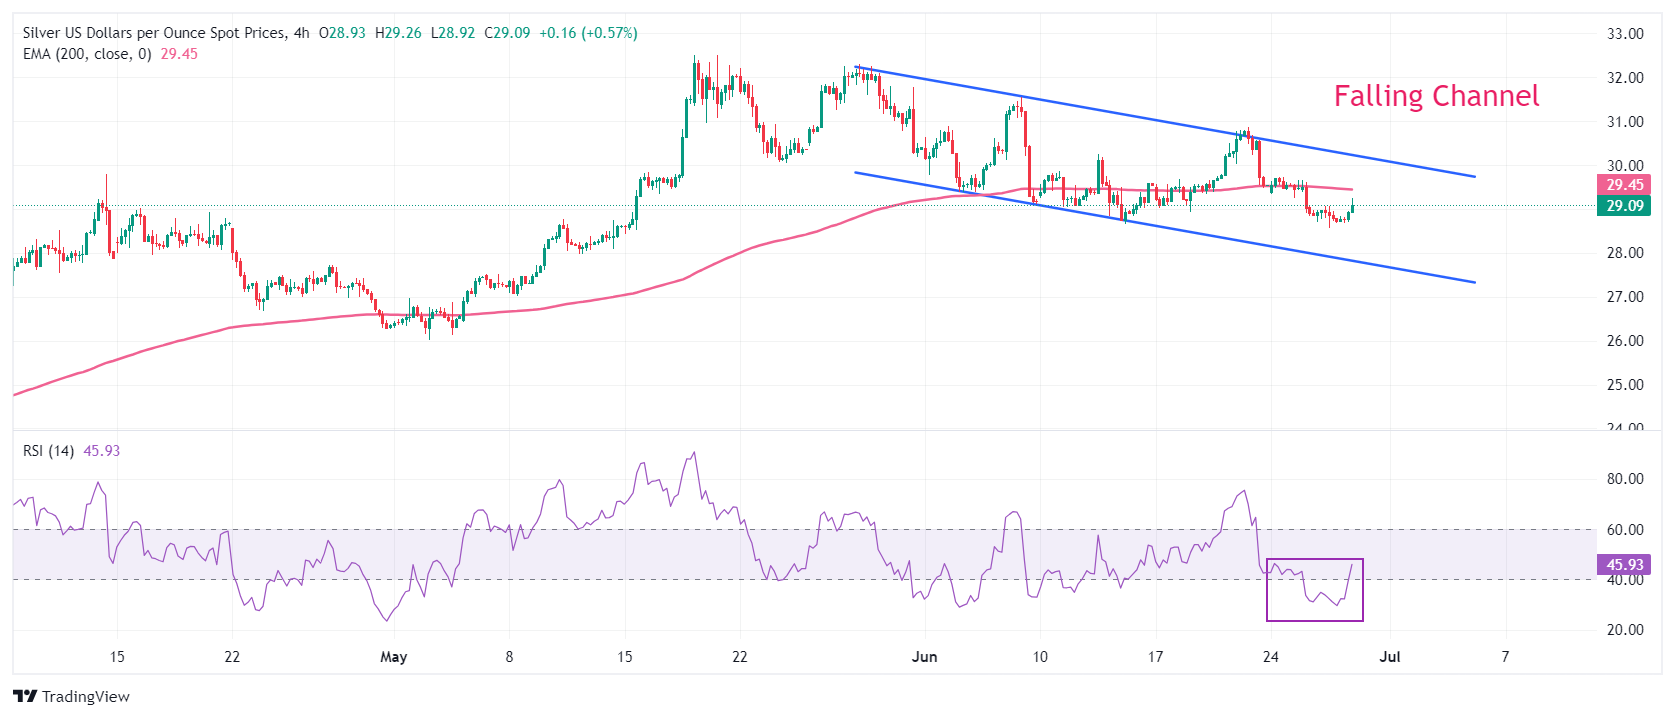
Silver price trades in a Falling Channel chart pattern in which each pullback is considered as selling opportunity by market participants. The white metal trades below the 200-period Exponential Moving Average (EMA), which trades around $29.45.
The 14-period Relative Strength Index (RSI) returns into the 40.00-60.00 range from the bearish trajectory of 20.00-40.00, suggesting that a downside momentum is over.
Silver four-hour chart
Economic Indicator
Core Personal Consumption Expenditures - Price Index (YoY)
The Core Personal Consumption Expenditures (PCE), released by the US Bureau of Economic Analysis on a monthly basis, measures the changes in the prices of goods and services purchased by consumers in the United States (US). The PCE Price Index is also the Federal Reserve’s (Fed) preferred gauge of inflation. The YoY reading compares the prices of goods in the reference month to the same month a year earlier. The core reading excludes the so-called more volatile food and energy components to give a more accurate measurement of price pressures." Generally, a high reading is bullish for the US Dollar (USD), while a low reading is bearish.
Read more.Next release: Fri Jun 28, 2024 12:30
Frequency: Monthly
Consensus: 2.6%
Previous: 2.8%
Source: US Bureau of Economic Analysis
After publishing the GDP report, the US Bureau of Economic Analysis releases the Personal Consumption Expenditures (PCE) Price Index data alongside the monthly changes in Personal Spending and Personal Income. FOMC policymakers use the annual Core PCE Price Index, which excludes volatile food and energy prices, as their primary gauge of inflation. A stronger-than-expected reading could help the USD outperform its rivals as it would hint at a possible hawkish shift in the Fed’s forward guidance and vice versa.
Author

Sagar Dua
FXStreet
Sagar Dua is associated with the financial markets from his college days. Along with pursuing post-graduation in Commerce in 2014, he started his markets training with chart analysis.


