Silver Price Analysis: XAG/USD struggles to keep bounce off 100-DMA below $24.00


  • Silver price remains sidelined after bouncing off seven-week low.
  • RSI suggests further recovery but bearish MACD signals, 50-DMA test XAG/USD bulls.
  • Silver buyers need validation from $24.65; downside break of 100-DMA highlights sub-$23.00 area for sellers.

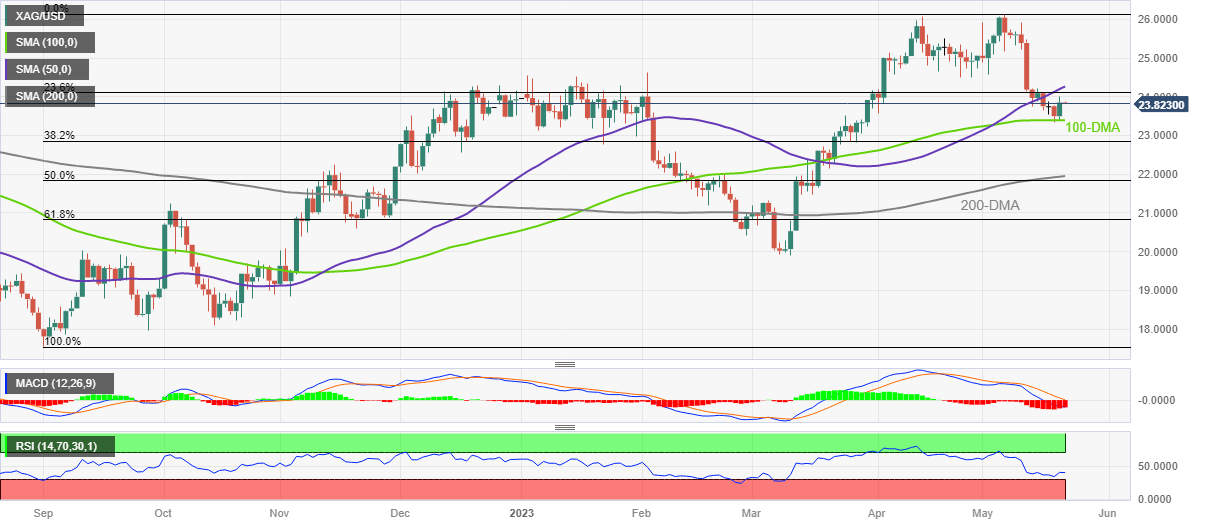
Silver price (XAG/USD) struggles to defend the previous day’s rebound from the key moving average to around $23.85 early Monday. In doing so, the bright metal remains sidelined after bouncing off the lowest levels since late March the previous day.

That said, the RSI (14) line recovers from the oversold territory, which in turn favors the XAG/USD rebound from the 100-DMA. However, the 50-DMA hurdle of around $24.25 joins the bearish MACD signals to challenge the metal buyers.

Even if the Silver price manages to remain firmer past $24.25, February’s high of around $24.65 can act as the last defense of the XAG/USD bears before directing the quote toward the $25.00.

Additionally, the Silver price upside past $25.00 may witness multiple stops near $25.30 and $25.50, a break of which might propel the bullion price toward the latest peak of around $26.15.

Alternatively, the XAG/USD sellers may wait for a daily closing beneath the 100-DMA support, close to $23.40 by the press time.

Following that, the 38.2% Fibonacci retracement level of the Silver Price upside from August 2022 to May 2023, near $22.85, will be key to watch for the sellers.

In a case where the XAG/USD stays bearish past $22.85, the 200-DMA and 50% Fibonacci retracement, respectively near $21.95 and $21.80, will be in the spotlight.

Silver price: Daily chart

Trend: Limited recovery expected

Additional important levels

Overview
Today last price 23.83
Today Daily Change -0.02
Today Daily Change % -0.08%
Today daily open 23.85
 
Trends
Daily SMA20 24.82
Daily SMA50 24.2
Daily SMA100 23.39
Daily SMA200 21.94
 
Levels
Previous Daily High 24.02
Previous Daily Low 23.4
Previous Weekly High 24.21
Previous Weekly Low 23.33
Previous Monthly High 26.09
Previous Monthly Low 23.57
Daily Fibonacci 38.2% 23.78
Daily Fibonacci 61.8% 23.63
Daily Pivot Point S1 23.49
Daily Pivot Point S2 23.14
Daily Pivot Point S3 22.87
Daily Pivot Point R1 24.11
Daily Pivot Point R2 24.38
Daily Pivot Point R3 24.73


Share: Feed news

Information on these pages contains forward-looking statements that involve risks and uncertainties. Markets and instruments profiled on this page are for informational purposes only and should not in any way come across as a recommendation to buy or sell in these assets. You should do your own thorough research before making any investment decisions. FXStreet does not in any way guarantee that this information is free from mistakes, errors, or material misstatements. It also does not guarantee that this information is of a timely nature. Investing in Open Markets involves a great deal of risk, including the loss of all or a portion of your investment, as well as emotional distress. All risks, losses and costs associated with investing, including total loss of principal, are your responsibility. The views and opinions expressed in this article are those of the authors and do not necessarily reflect the official policy or position of FXStreet nor its advertisers. The author will not be held responsible for information that is found at the end of links posted on this page.

If not otherwise explicitly mentioned in the body of the article, at the time of writing, the author has no position in any stock mentioned in this article and no business relationship with any company mentioned. The author has not received compensation for writing this article, other than from FXStreet.

FXStreet and the author do not provide personalized recommendations. The author makes no representations as to the accuracy, completeness, or suitability of this information. FXStreet and the author will not be liable for any errors, omissions or any losses, injuries or damages arising from this information and its display or use. Errors and omissions excepted.

The author and FXStreet are not registered investment advisors and nothing in this article is intended to be investment advice.

Recommended content


Recommended content

Editors’ Picks

EUR/USD clings to daily gains above 1.0650

EUR/USD clings to daily gains above 1.0650

EUR/USD gained traction and turned positive on the day above 1.0650. The improvement seen in risk mood following the earlier flight to safety weighs on the US Dollar ahead of the weekend and helps the pair push higher.

EUR/USD News

GBP/USD recovers toward 1.2450 after UK Retail Sales data

GBP/USD recovers toward 1.2450 after UK Retail Sales data

GBP/USD reversed its direction and advanced to the 1.2450 area after touching a fresh multi-month low below 1.2400 in the Asian session. The positive shift seen in risk mood on easing fears over a deepening Iran-Israel conflict supports the pair.

GBP/USD News

Gold holds steady at around $2,380 following earlier spike

Gold holds steady at around $2,380 following earlier spike

Gold stabilized near $2,380 after spiking above $2,400 with the immediate reaction to reports of Israel striking Iran. Meanwhile, the pullback seen in the US Treasury bond yields helps XAU/USD hold its ground.

Gold News

Bitcoin Weekly Forecast: BTC post-halving rally could be partially priced in Premium

Bitcoin Weekly Forecast: BTC post-halving rally could be partially priced in

Bitcoin price shows no signs of directional bias while it holds above  $60,000. The fourth BTC halving is partially priced in, according to Deutsche Bank’s research. 

Read more

Week ahead – US GDP and BoJ decision on top of next week’s agenda

Week ahead – US GDP and BoJ decision on top of next week’s agenda

US GDP, core PCE and PMIs the next tests for the Dollar. Investors await BoJ for guidance about next rate hike. EU and UK PMIs, as well as Australian CPIs also on tap.

Read more

Forex MAJORS

Cryptocurrencies

Signatures