Silver Price Analysis: XAG/USD bears have the upper hand, break below mid-$26.00 awaited


  • Silver turns lower for the third straight day, albeit holds above a multi-month trough.
  • The technical setup favors bearish traders and supports prospects for deeper losses.
  • A sustained strength beyond the $ 27.55-$27.60 might trigger a short-covering rally.

Silver (XAG/USD) meets with some supply following an intraday uptick to the $27.25-$27.30 region and turns lower for the third successive day during the first half of the European session on Wednesday. The white metal, however, manages to hold its neck above a three-month low touched on Monday and currently trades around the $27.00 round-figure mark. 

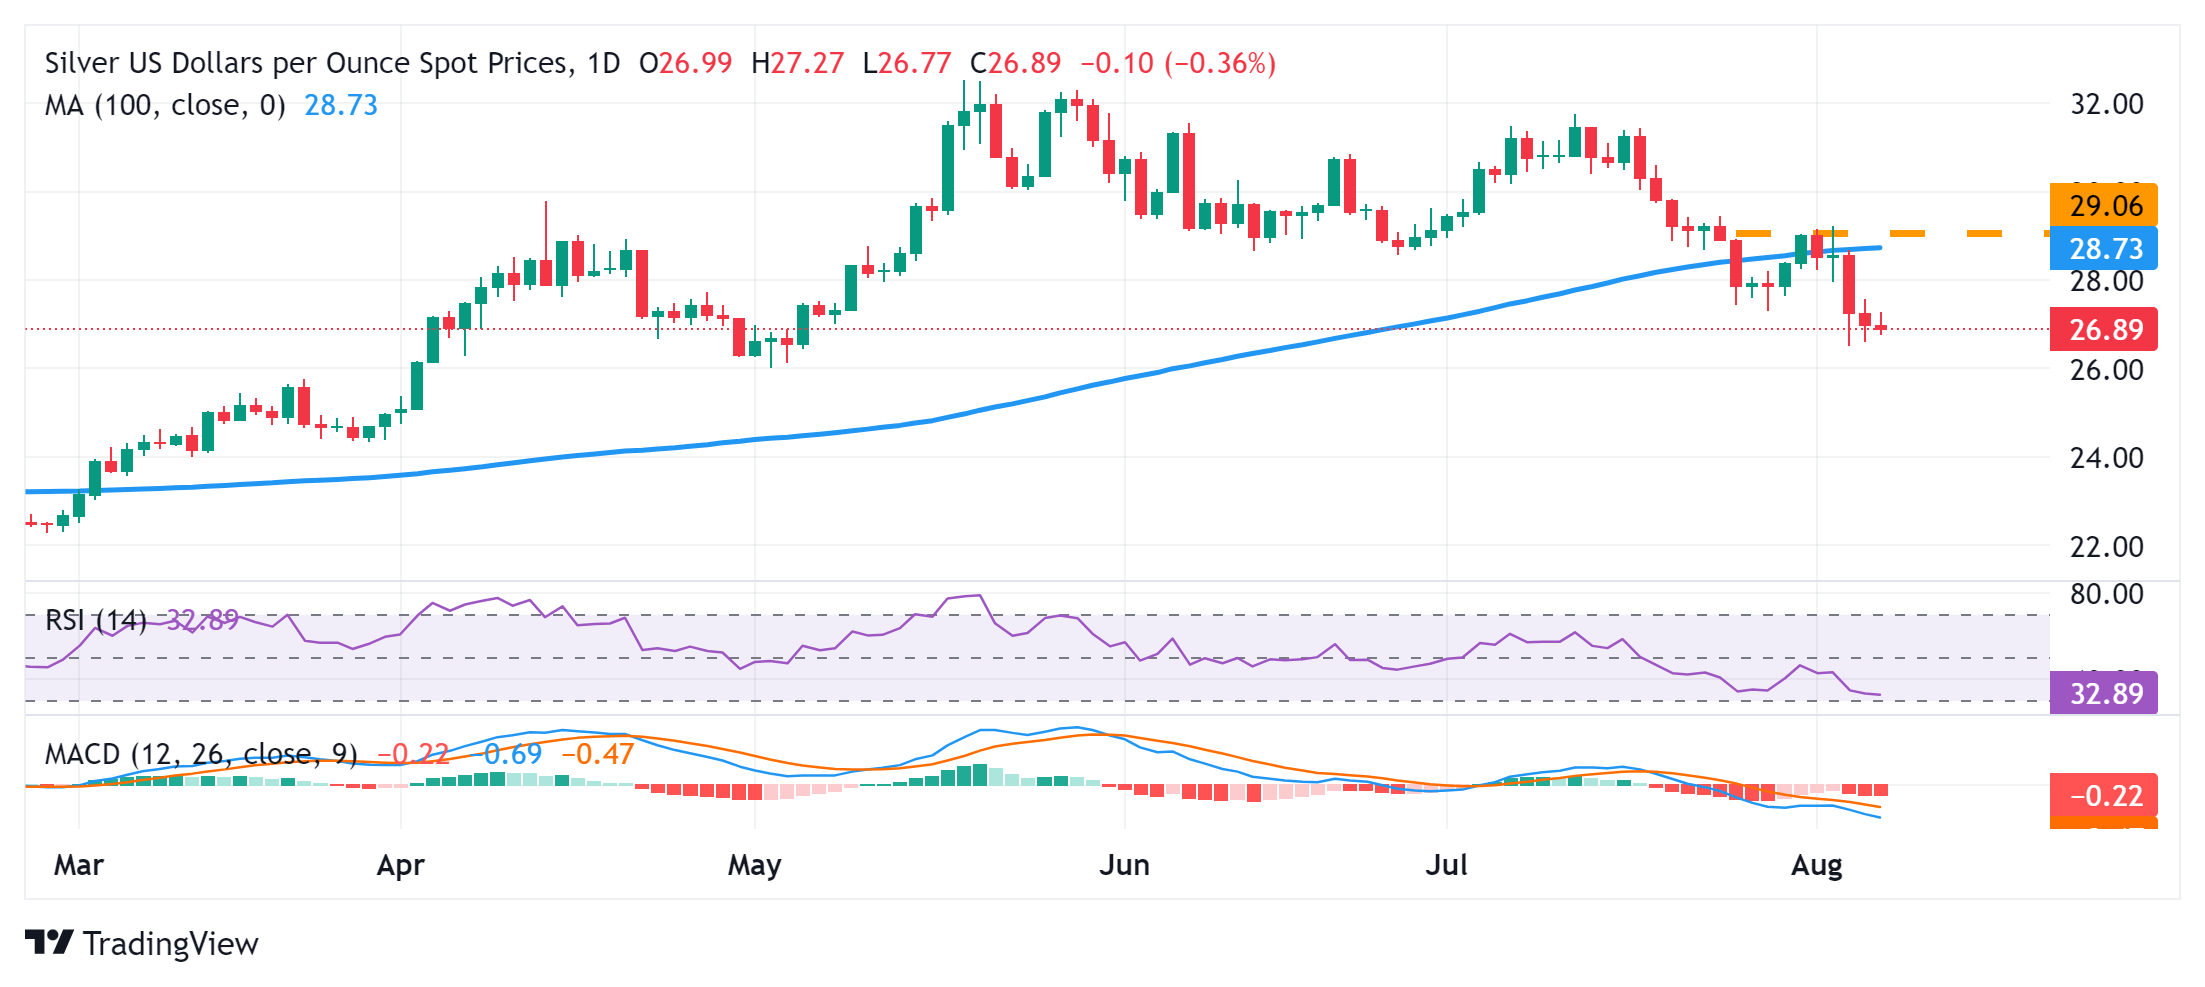
Against the backdrop of the recent beak down through the very important 200-day Simple Moving Average (SMA) and failures near the $29.00 mark, the emergence of fresh selling favors bearish traders. Moreover, technical indicators on the daily chart are holding deep in negative territory and are still far from being in the oversold zone. This, in turn, validates the negative outlook and suggests that the path of least resistance for the XAG/USD is to the downside. 

Traders, however, might wait for some follow-through selling below the weekly low, around mid-$26.00s, before positioning for the next leg of a downfall. The XAG/USD might then accelerate the slide towards the $26.00 round figure before dropping to the next relevant support to the $25.65-$25.60 region. The downward trajectory could extend further towards challenging the $25.00 psychological mark en route to the $24.45-$24.40 horizontal support.

On the flip side, any meaningful recovery attempt is likely to confront stiff resistance near the overnight swing high, around the $27.55-$27.60 region. A sustained strength beyond, however, might trigger a short-covering rally and lift the XAG/USD beyond the $28.00 round-figure, towards challenging the 200-day SMA support-turned-resistance, currently pegged near the $28.80 area. The $29.00 mark, meanwhile, might continue to cap the upside.

Silver daily chart

fxsoriginal

Silver FAQs

Silver is a precious metal highly traded among investors. It has been historically used as a store of value and a medium of exchange. Although less popular than Gold, traders may turn to Silver to diversify their investment portfolio, for its intrinsic value or as a potential hedge during high-inflation periods. Investors can buy physical Silver, in coins or in bars, or trade it through vehicles such as Exchange Traded Funds, which track its price on international markets.

Silver prices can move due to a wide range of factors. Geopolitical instability or fears of a deep recession can make Silver price escalate due to its safe-haven status, although to a lesser extent than Gold's. As a yieldless asset, Silver tends to rise with lower interest rates. Its moves also depend on how the US Dollar (USD) behaves as the asset is priced in dollars (XAG/USD). A strong Dollar tends to keep the price of Silver at bay, whereas a weaker Dollar is likely to propel prices up. Other factors such as investment demand, mining supply – Silver is much more abundant than Gold – and recycling rates can also affect prices.

Silver is widely used in industry, particularly in sectors such as electronics or solar energy, as it has one of the highest electric conductivity of all metals – more than Copper and Gold. A surge in demand can increase prices, while a decline tends to lower them. Dynamics in the US, Chinese and Indian economies can also contribute to price swings: for the US and particularly China, their big industrial sectors use Silver in various processes; in India, consumers’ demand for the precious metal for jewellery also plays a key role in setting prices.

Silver prices tend to follow Gold's moves. When Gold prices rise, Silver typically follows suit, as their status as safe-haven assets is similar. The Gold/Silver ratio, which shows the number of ounces of Silver needed to equal the value of one ounce of Gold, may help to determine the relative valuation between both metals. Some investors may consider a high ratio as an indicator that Silver is undervalued, or Gold is overvalued. On the contrary, a low ratio might suggest that Gold is undervalued relative to Silver.


Share: Feed news

Information on these pages contains forward-looking statements that involve risks and uncertainties. Markets and instruments profiled on this page are for informational purposes only and should not in any way come across as a recommendation to buy or sell in these assets. You should do your own thorough research before making any investment decisions. FXStreet does not in any way guarantee that this information is free from mistakes, errors, or material misstatements. It also does not guarantee that this information is of a timely nature. Investing in Open Markets involves a great deal of risk, including the loss of all or a portion of your investment, as well as emotional distress. All risks, losses and costs associated with investing, including total loss of principal, are your responsibility. The views and opinions expressed in this article are those of the authors and do not necessarily reflect the official policy or position of FXStreet nor its advertisers. The author will not be held responsible for information that is found at the end of links posted on this page.

If not otherwise explicitly mentioned in the body of the article, at the time of writing, the author has no position in any stock mentioned in this article and no business relationship with any company mentioned. The author has not received compensation for writing this article, other than from FXStreet.

FXStreet and the author do not provide personalized recommendations. The author makes no representations as to the accuracy, completeness, or suitability of this information. FXStreet and the author will not be liable for any errors, omissions or any losses, injuries or damages arising from this information and its display or use. Errors and omissions excepted.

The author and FXStreet are not registered investment advisors and nothing in this article is intended to be investment advice.

XM
Account
7.2
Tools
9.2
Service
9.4
Trading
9.0
Trust
7.0
Experience
8.4
Read review
Moneta Markets
Account
7.4
Tools
6.6
Service
8.0
Trading
6.6
Trust
5.2
Experience
9.2
Read review
Trading Pro
Account
7.2
Tools
5.2
Service
6.6
Trading
8.0
Trust
5.0
Experience
7.0
Read review
Pepperstone
Account
8.2
Tools
8.2
Service
7.4
Trading
9.0
Trust
8.8
Experience
9.0
Read review
XM
Read review
Moneta Markets
Read review
Trading Pro
Read review
Pepperstone
Read review
Trading Pro
Read review
Pepperstone
Read review
XM
Read review
Moneta Markets
Read review
Trading Pro
Account
7.2
Tools
5.2
Service
6.6
Trading
8.0
Trust
5.0
Experience
7.0
Read review
Pepperstone
Account
8.2
Tools
8.2
Service
7.4
Trading
9.0
Trust
8.8
Experience
9.0
Read review
XM
Account
7.2
Tools
9.2
Service
9.4
Trading
9.0
Trust
7.0
Experience
8.4
Read review
Moneta Markets
Account
7.4
Tools
6.6
Service
8.0
Trading
6.6
Trust
5.2
Experience
9.2
Read review

Recommended content


Recommended content

Editors’ Picks

EUR/USD clings to strong gains above 1.1050 as US-China trade war deepens

EUR/USD clings to strong gains above 1.1050 as US-China trade war deepens Premium

EUR/USD trades decisively higher on the day above 1.1050 on Wednesday as the US Dollar (USD) stays under persistent selling pressure on growing fears over a recession, as a result of the US trade war with China. Later in the American session, the Federal Reserve will release the minutes of the March policy meeting.

EUR/USD News
GBP/USD holds above 1.2800 on broad USD weakness

GBP/USD holds above 1.2800 on broad USD weakness

GBP/USD stays in positive territory above 1.2800 in the American session on Wednesday.  After China's decision to respond to the US tariffs by imposing additional 84% tariffs on US goods, the US Dollar remains under pressure and helps the pair hold its ground ahead of FOMC Minutes.

GBP/USD News
Gold extends rally to $3,050 area as safe-haven flows dominate markets

Gold extends rally to $3,050 area as safe-haven flows dominate markets

Gold preserves its bullish momentum and trades near $3,050 in the second half of the day. Further escalation in the trade conflict between the US and China force markets to remain risk-averse midweek, allowing the precious metal to capitalize on safe-haven flows.

Gold News
Top 3 gainers NEO, Plume and Story: NEO surges despite Trump's tariff firestorm as investors succumb to extreme fear

Top 3 gainers NEO, Plume and Story: NEO surges despite Trump's tariff firestorm as investors succumb to extreme fear

Cryptocurrencies are enduring progressive market carnage from the US President Donald Trump administration's incessant tariffs on its trade partners, with some selected altcoins like NEO, Plume and Story (IP) leading the bullish brigade on Wednesday.

Read more
Tariff rollercoaster continues as China slapped with 104% levies

Tariff rollercoaster continues as China slapped with 104% levies

The reaction in currencies has not been as predictable. The clear winners so far remain the safe-haven Japanese yen and Swiss franc, no surprises there, while the euro has also emerged as a quasi-safe-haven given its high liquid status.

Read more
The Best brokers to trade EUR/USD

The Best brokers to trade EUR/USD

SPONSORED Discover the top brokers for trading EUR/USD in 2025. Our list features brokers with competitive spreads, fast execution, and powerful platforms. Whether you're a beginner or an expert, find the right partner to navigate the dynamic Forex market.

Read More

Forex MAJORS

Cryptocurrencies

Signatures

Best Brokers of 2025