|

Silver Price Analysis: Establishes another lower low as downtrend extends

  • Silver posts another lower low as it continues its steady decline. 
  • The 50-day SMA, however, could provide an obstacle to further weakness. 
  • The RSI momentum indicator is converging bullishly with price.  

Silver (XAG/USD) trades almost 2.0% lower on Thursday after the release of US factory-gate inflation data.

The precious metal has broken below $29.04 (June 11 low) and thereby posted a lower low at $28.85, the low of the day. 

The sequence of lower lows and lower highs witnessed since the May highs suggests Silver is in a short-term downtrend, which given “the trend is your friend” is expected to extend. 

Silver 4-hour Chart 

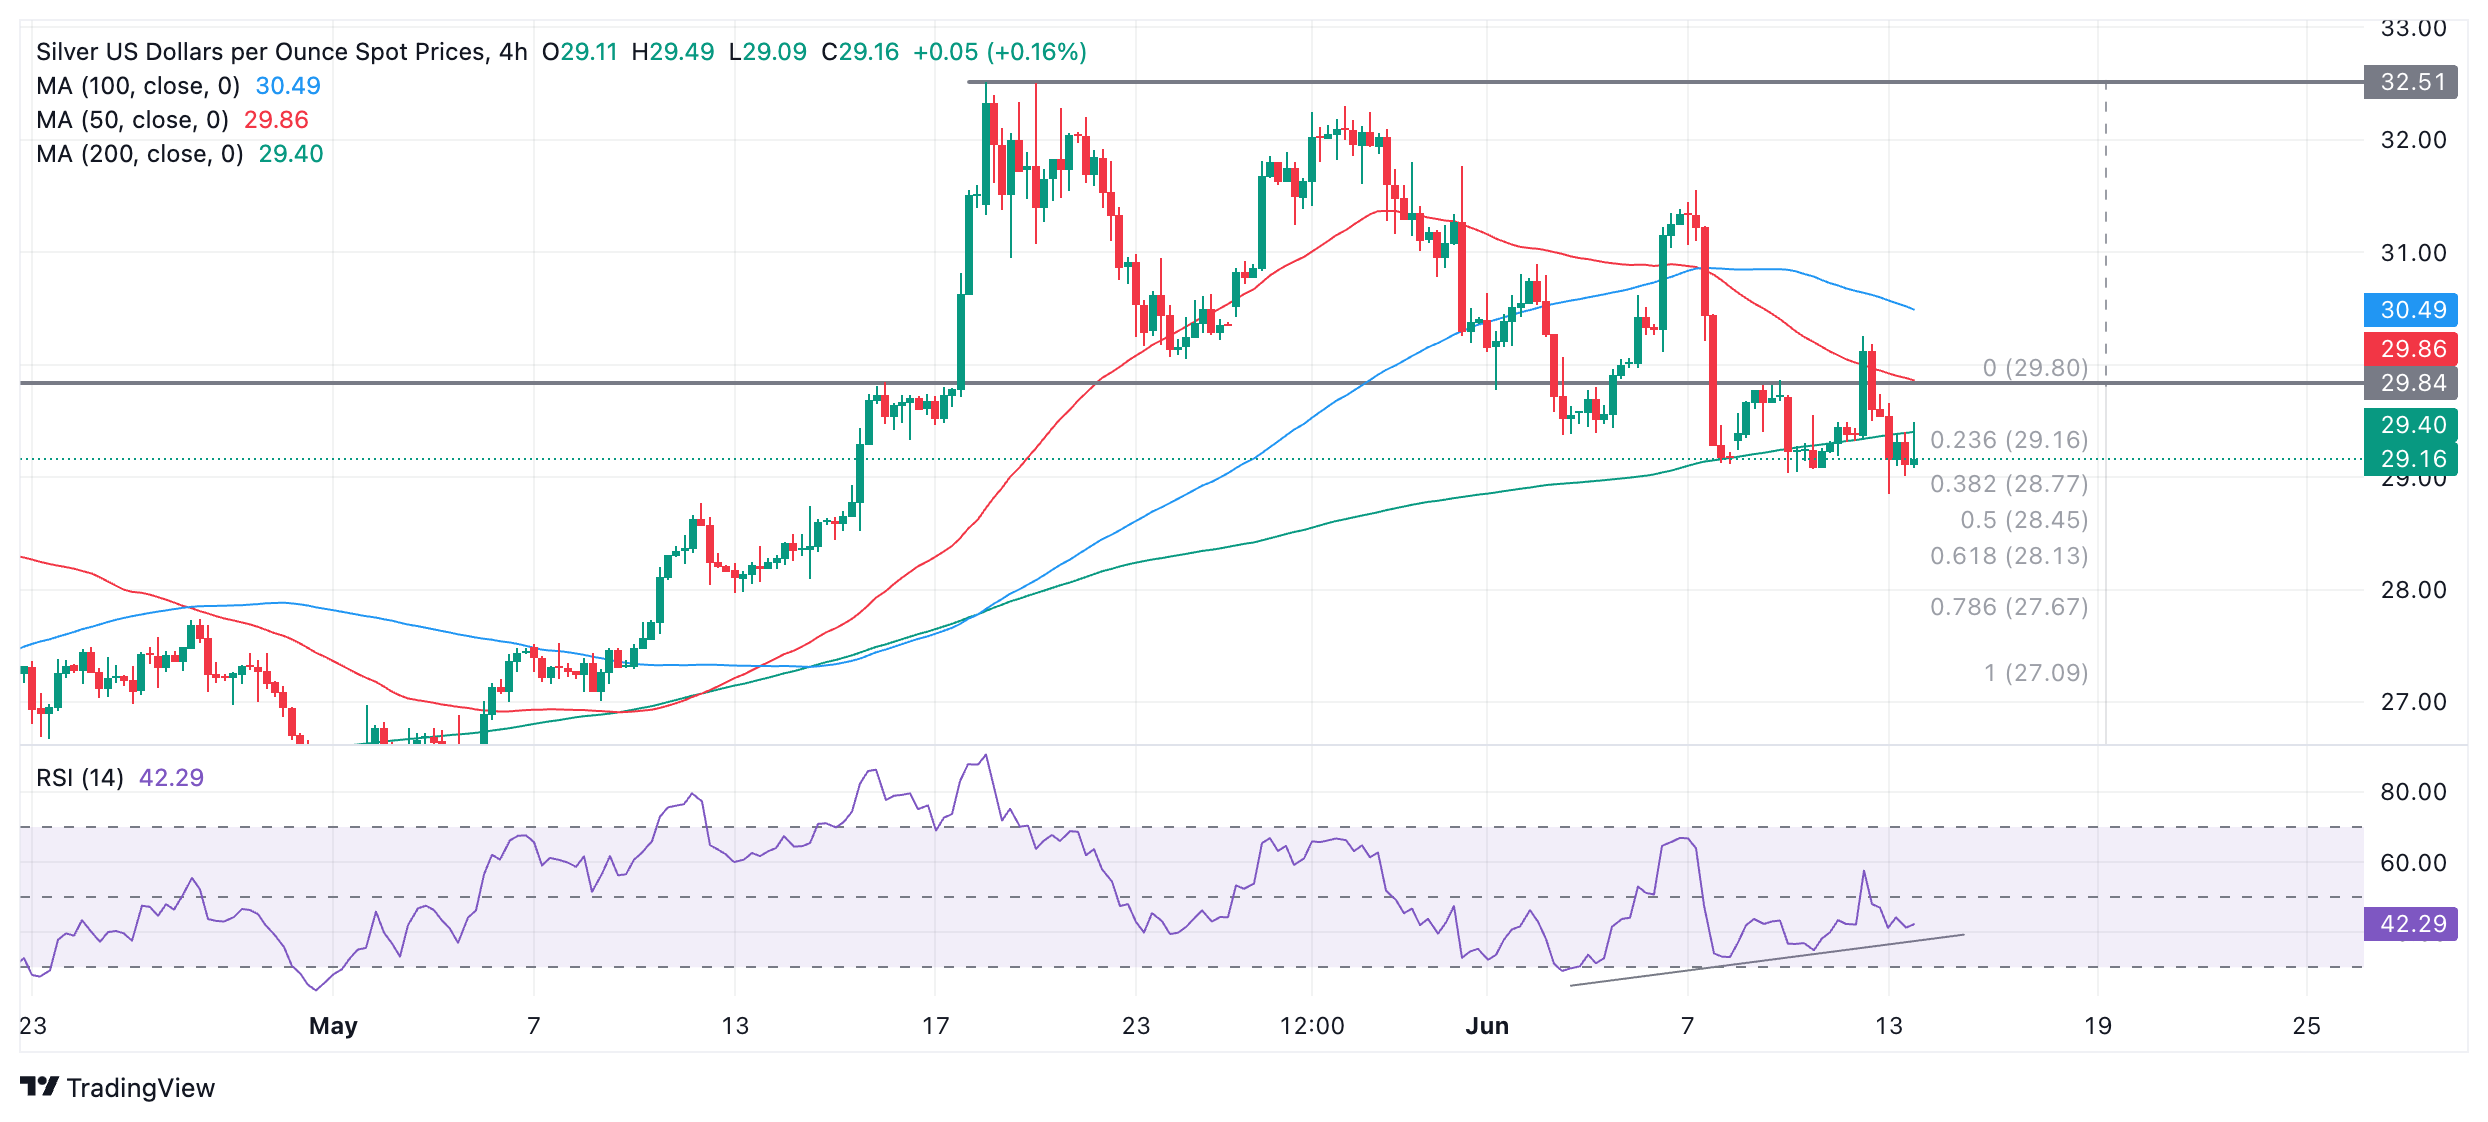
A break below $28.85 (June 13 low) would confirm another lower low, continuing the bearish sequence. 

There is a chance Silver could fall to an initial target at $28.21, the 0.618 Fibonacci ratio of the height of the range that unfolded in the second half of May, extrapolated lower. This is the usual method used by technical analysts for establishing targets after breakouts from ranges.

The 50-day Simple Moving Average (SMA) at $28.93, however, could provide a barrier to further downside. 

That said, more bearishness could still see Silver reach as low as $27.19, the second target at the 100% extrapolation of the height of the range lower. 

The Relative Strength Index (RSI) is showing bullish convergence with price since the June 4 low. Although price has gone on to make progressively lower lows, RSI has not. The non-correlation indicates a lack of bearish momentum and increases the risk of Silver making a pullback or a recovery. 

It would take a close above $31.00 to bring the short-term downtrend into doubt. A move above the $31.55 lower high would suggest the possibility of a recovery to the range high at $32.51, and a reversal of the short-term trend too. 

Author

Joaquin Monfort

Joaquin Monfort is a financial writer and analyst with over 10 years experience writing about financial markets and alt data. He holds a degree in Anthropology from London University and a Diploma in Technical analysis.

More from Joaquin Monfort
Share:

Markets move fast. We move first.

Orange Juice Newsletter brings you expert driven insights - not headlines. Every day on your inbox.

By subscribing you agree to our Terms and conditions.

Editor's Picks

EUR/USD: Bulls pray for a dovish Fed

EUR/USD has finally taken a breather after a pretty energetic climb. The pair broke above 1.1680 in the second half of the week, reaching its highest levels in around two months before running into some selling pressure. Even so, it has gained almost two cents from the late-November dip just below 1.1500 the figure.

GBP/USD trims gains, recedes toward 1.3320

GBP/USD is struggling to keep its daily advance, coming under fresh pressure and retreating to the 1.3320 zone following a mild bullish attempt in the Greenback. Even though US consumer sentiment surprised to the upside, the US Dollar isn’t getting much love, as traders are far more interested in what the Fed will say next week.

Gold: Bullish momentum fades despite broad USD weakness

After rising more than 3.5% in the previous week, Gold has entered a consolidation phase and fluctuated at around $4,200. The Federal Reserve’s interest rate decision and revised Summary of Economic Projections, also known as the dot plot, could trigger the next directional move in XAU/USD. 

Week ahead: Rate cut or market shock? The Fed decides

Fed rate cut widely expected; dot plot and overall meeting rhetoric also matter. Risk appetite is supported by Fed rate cut expectations; cryptos show signs of life. RBA, BoC and SNB also meet; chances of surprises are relatively low. Dollar weakness could linger; both the aussie and the yen best positioned to gain further. Gold and oil eye Ukraine-Russia developments; a peace deal remains elusive.

Week ahead – Rate cut or market shock? The Fed decides

Fed rate cut widely expected; dot plot and overall meeting rhetoric also matter. Risk appetite is supported by Fed rate cut expectations; cryptos show signs of life. RBA, BoC and SNB also meet; chances of surprises are relatively low.

Ripple faces persistent bear risks, shrugging off ETF inflows

Ripple is extending its decline for the second consecutive day, trading at $2.06 at the time of writing on Friday. Sentiment surrounding the cross-border remittance token continues to lag despite steady inflows into XRP spot ETFs.