|

Sherwin-Williams continues its twelve session slide on Thursday

  • Sherwin-Williams was added to the Dow Jones on November 8.
  • Since entering the DJIA, shares have lost 4.5%.
  • SHW stock has closed below its daily open for 12 straight sessions.
  • Shares of the paint company are now below the 100-day moving average for first time since July.

The Sherwin-Williams Company (SHW) continued plodding lower on Thursday, alongside the broader market. The paint and coatings company has now closed lower than its opening price in 12 straight sessions. SHW lost 1.37% on Thursday.

All the major US indices were in close proximity on Thor’s day of the week, but the Dow Jones Industrial Average (DJIA), which includes Sherwin-Williams stock, dropped the least at -0.53%. The US Producer Price Index (PPI) showed that November inflation was growing worse rather than getting better.

Sherwin-Williams stock news and chart

Sherwin-Williams stock has been volatile since being included in the Dow Jones index on November 8 when it replaced Dow (DOW), the chemical company. Since the Dow index is price-weighted, SHW stock makes up approximately 5.3% of the index.

SHW shares have lost nearly 4.5% since joining the Dow despite reaching $400 per share in late November. Shares are still up more than 17% year to date.

There has been little news to sway traders, and it would seem that the recent downtrend is a product of long-time bulls taking profits off the table. 

Ten of the last 12 sessions have noted daily chart losses, and SHW stock now trades below the 100-day Simple Moving Average (SMA). This is the first time that has happened since July 12.

SHW stock now trades firmly within the $358 to $371 high-volume region. If shares fall below $358 and out of this support channel, then expect a move to the 200-day SMA near $343.

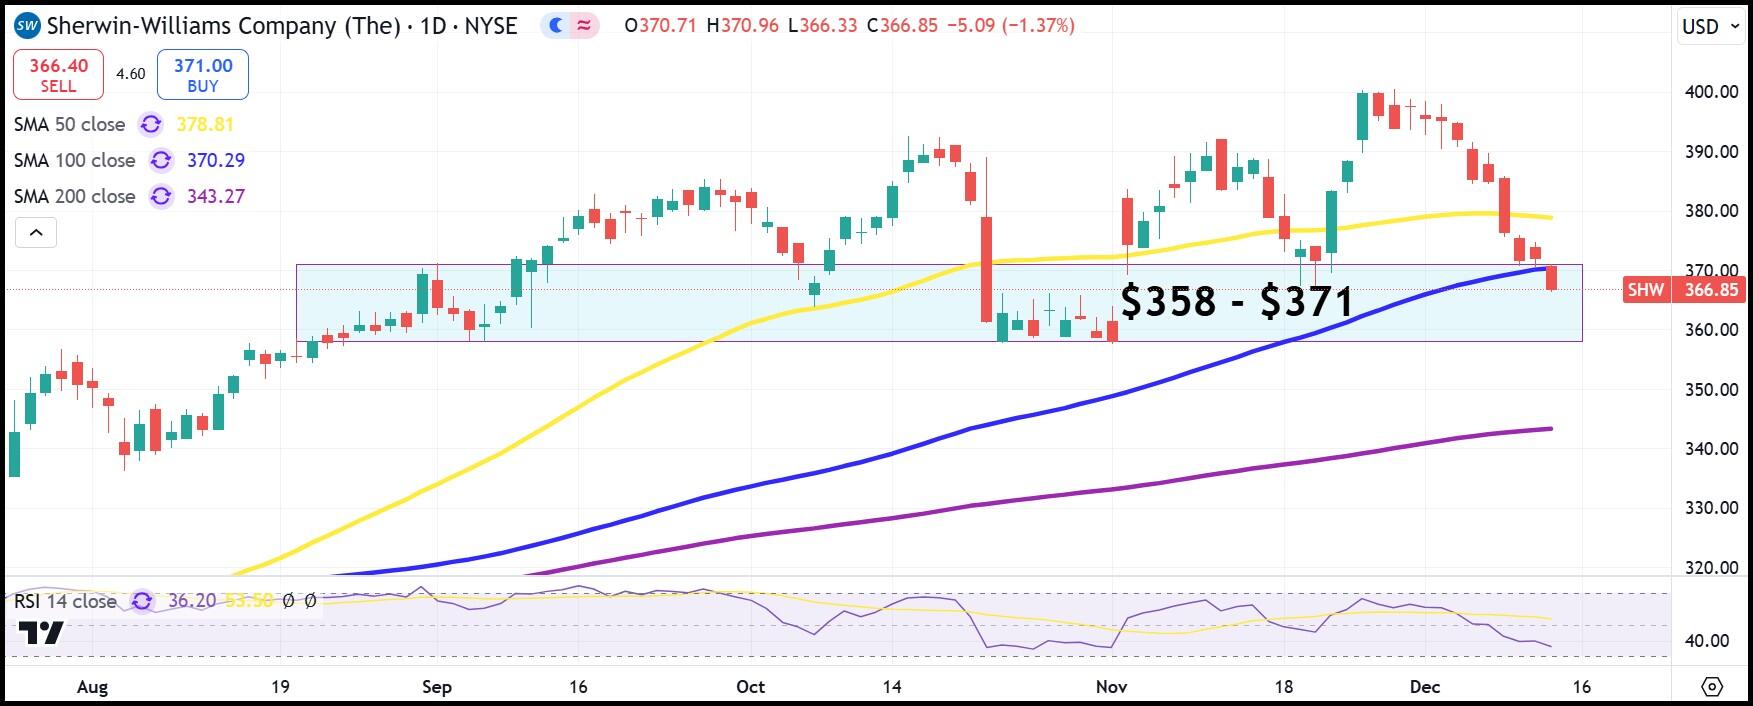
SHW daily stock chart
 

Premium

You have reached your limit of 3 free articles for this month.

Start your subscription and get access to all our original articles.

Subscribe to PremiumSign In

Author

Clay Webster

Clay Webster

FXStreet

Clay Webster grew up in the US outside Buffalo, New York and Lancaster, Pennsylvania. He began investing after college following the 2008 financial crisis.

More from Clay Webster
Share:

Markets move fast. We move first.

Orange Juice Newsletter brings you expert driven insights - not headlines. Every day on your inbox.

By subscribing you agree to our Terms and conditions.

Editor's Picks

EUR/USD off three-month highs, holds near 1.1800 on softer US Dollar

EUR/USD consolidates gains below 1.1800 in the European trading hours on Wednesday. A broadly subdued US Dollar continues to underpin the pair amid quiet markets and thin liquidity conditions on Christmas Eve. 

GBP/USD keeps range around 1.3500 amid quiet markets

GBP/USD keeps its range trade intact at around 1.3500 in the European session on Wednesday. The Pound Sterling holds the upper hand over the US Dollar amid pre-Christmas light trading as traders turn to sidelines heading into the holiday season. 

Gold retreats from record highs amid profit-taking on Christmas Eve

Gold retreats following the move higher to the $4,525 area, or a fresh all-time peak, though the downside remains limited amid a bullish fundamental backdrop. The US Dollar selling bias remains unabated on the back of dovish Fed expectations, which continues to act as a tailwind for the bullion amid persistent geopolitical risks.

Shiba Inu's bears tighten grip, aiming for yearly lows

Shiba Inu price remains under pressure, trading below $0.000070 on Wednesday as bearish momentum continues to dominate the broader crypto market. On-chain and derivatives data further support the bearish sentiment, while technical analysis suggests a deeper correction targeting the yearly lows.

Economic outlook 2026-2027 in advanced countries: Solidity test

After a year marked by global economic resilience and ending on a note of optimism, 2026 looks promising and could be a year of solid economic performance. In our baseline scenario, we expect most of the supportive factors at work in 2025 to continue to play a role in 2026.

Stellar Price Forecast: XLM slips below $0.22 as bearish momentum builds

Stellar (XLM) price is trading below $0.22 at the time of writing on Wednesday after failing to close above the key resistance earlier this week. Bearish momentum continues to strengthen, with open interest falling and short bets rising.