Pound Sterling Price News and Forecast: GBP/USD dips further after downbeat UK Retail Sales [Video]
![Pound Sterling Price News and Forecast: GBP/USD dips further after downbeat UK Retail Sales [Video]](https://editorial.fxstreet.com/images/Markets/Currencies/Majors/GBPUSD/iStock-1178148633_XtraLarge.jpg)
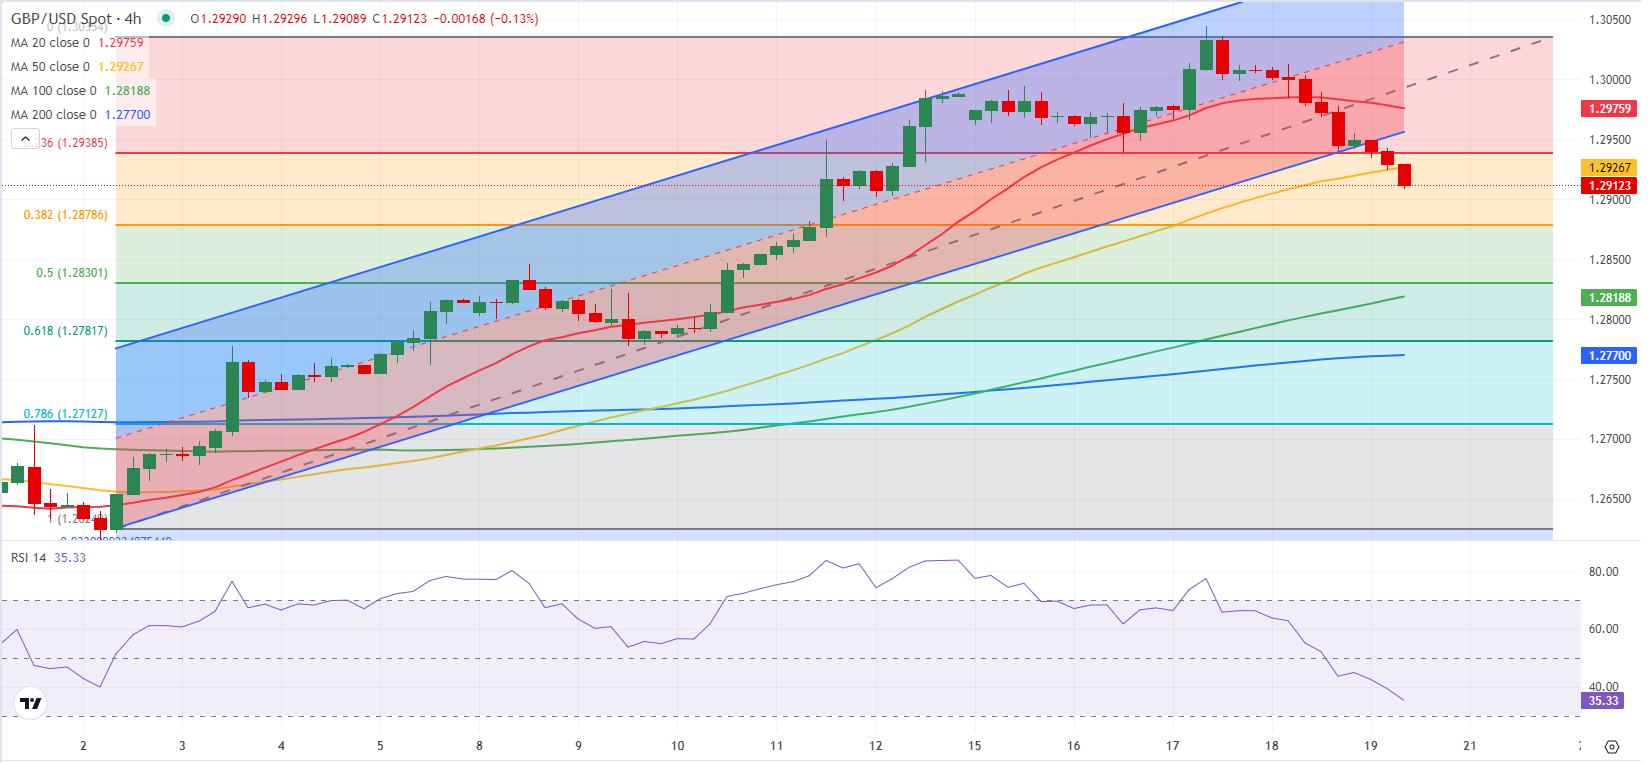
GBP/USD outlook: Cable dips further after downbeat UK Retail Sales
Cable remains in red for the second consecutive day and extends pullback from new one-year high (1.3044). Weaker than expected UK retail sales increase pressure on sterling and add to bets for BoE rate cut in August (currently at 44%).
Fresh bears broke below the floor of recent consolidation (around Fibo 23.6% of 1.2615/1.3044 upleg), generating initial bearish signal, with extension below cracked rising 10DMA (1.2914) to validate the signal and close below 1.2879 (Fibo 38.2%) to generate initial reversal signal. Also, formation of bull-trap above 1.30 barrier on weekly chart, may add to downside risk. Read more...
-638569868917651774.png)
GBP/USD Forecast: Pound Sterling sellers take action as mood sours
After closing in negative territory on Thursday, GBP/USD stays under bearish pressure and falls toward 1.2900 in the European session on Friday, as the US Dollar (USD) benefits from the negative shift seen in risk sentiment.
Wall Street's main indexes turned south after the opening bell on Thursday, helping the USD find demand in the second half of the day. Early Friday, the data published by the UK's Office for National Statistics showed that Retail Sales declined 1.2% on a monthly basis in June. This reading followed the 2.9% increase recorded in May and came in weaker than analysts' forecast of -0.4%, further weighing on Pound Sterling. Read more...
GBP/USD Elliott Wave technical analysis [Video]
The GBPUSD Elliott Wave Analysis on the daily chart examines the British Pound to U.S. Dollar currency pair using Elliott Wave Theory. This analysis focuses on identifying and interpreting market movements within a counter trend. The mode of the analysis is corrective, indicating that the current wave pattern represents a correction within the larger trend.
The specific wave structure under observation is Orange Wave 2, signifying that the market is in the second wave of an overall corrective pattern. Within this structure, the position is Navy Blue Wave 3, indicating that the currency pair is in the third wave of a smaller degree within the Orange Wave 2. Read more...
Author

FXStreet Team
FXStreet


