Oil on the brink of turning green with the US session opening the Fed's Jackson Hole week
- Oil price on the brink of flipping a negative performance into a positive one for this Monday's trading day.
- Prices retreated earlier as traders focused on Chinese demand fears and efforts to get a ceasefire deal in Gaza.
- The US Dollar Index eases further after hedge funds go long on the Japanese Yen, which appreciates against the Greenback.

Oil turns flat ahead of the US trading session, although risk elements that pushed prices lower this Monday are not fading that easily. Traders are fearing weaker demand again from Oil importer China, weighing on overall market sentiment. Meanwhile, all eyes are on the Middle East, where a successful outcome of Gaza ceasefire talks could reduce supply risks substantially, according to Reuters. With two major risk premium events being priced out, some more easing in Crude prices might be at hand.
The US Dollar Index (DXY), which tracks the performance of the US Dollar against six major currencies, is feeling the heat from the Japanese Yen. Markets got rattled on Friday after the Commodity Futures Trading Commission (CFTC) reported that hedge funds were back to being net long on the Japanese Yen (JPY) for the first time since 2021. This weighed on the Greenback and spilled over into the DXY’s performance, which flirts with a break below 102 ahead of the Federal Reserve’s Jackson Hole Symposium later this week.
At the time of writing, Crude Oil (WTI) trades at $75.37 and Brent Crude at $78.93
Oil news and market movers: Finally there?
- US Secretary of State Antony Blinken has joined up with the Prime Minister of Israel Benjamin Netanyahu on Monday. Bloomberg reports that Netanyahu said the meeting was positive and Israel is commited to follow the US proposal that is currently on the table.
- Bloomberg reports that Iran has jacked up the premium on its light crude prices by $2.35 per barrel over the benchmark Oman-Dubai pricing for September sales to Asia. The move is rather strange taking into account that markets are concerned about a slowdown from China.
- The weekly Commodity Futures Trading Commission (CFTC) data revealed that hedge funds are still net long on Crude Oil even though price action has not been outperforming these past few weeks. Bloomberg reports that hedge funds might be compelled to cut their stake if crude does not gain ground this week, adding to more selling pressure.
- Oil output in Libya has increased by 300,000 barrels per day with the Waha Oil production back to normal levels after maintenance, Reuters reports.
- Headline risk is to be considered with ceasefire talks on Gaza taking place in the coming days.
Oil Technical Analysis: Hedge Funds in the driving seat
A big warning already appeared last week on charts after Oil prices were unable to cross over the important 100-day Simple Moving Average (SMA) around $78.45, a key technical level. With that rejection unfolding, the Relative Strength Index (RSI) in the daily chart is still trading fairly in the middle of its range, not looking oversold. This could mean more downside to come, particularly when hedge funds start to cut their stake, triggering a further slide towards $72.00 or lower.
On the upside, it becomes very difficult to be bullish with a lot of resistance levels nearby. The first element to look out for is the pivotal $75.27. Next up is the double level at $77.65, which aligns with both a descending trendline and the 200-day Simple Moving Average (SMA). In case bulls are able to break above it, the 100-day SMA at $78.45 could trigger another rejection as it did last week.
On the downside, the low from August 5 at $71.17 is the best level for a bounce. It might not be bad to start considering levels below $70.00 in case ceasefire talks reach a breakthrough and hedge funds start selling their speculative stake in Oil contracts. The $68.00 big figure level is the first level to watch followed by $67.11, which is the lowest point from the triple bottom seen back in June 2023.
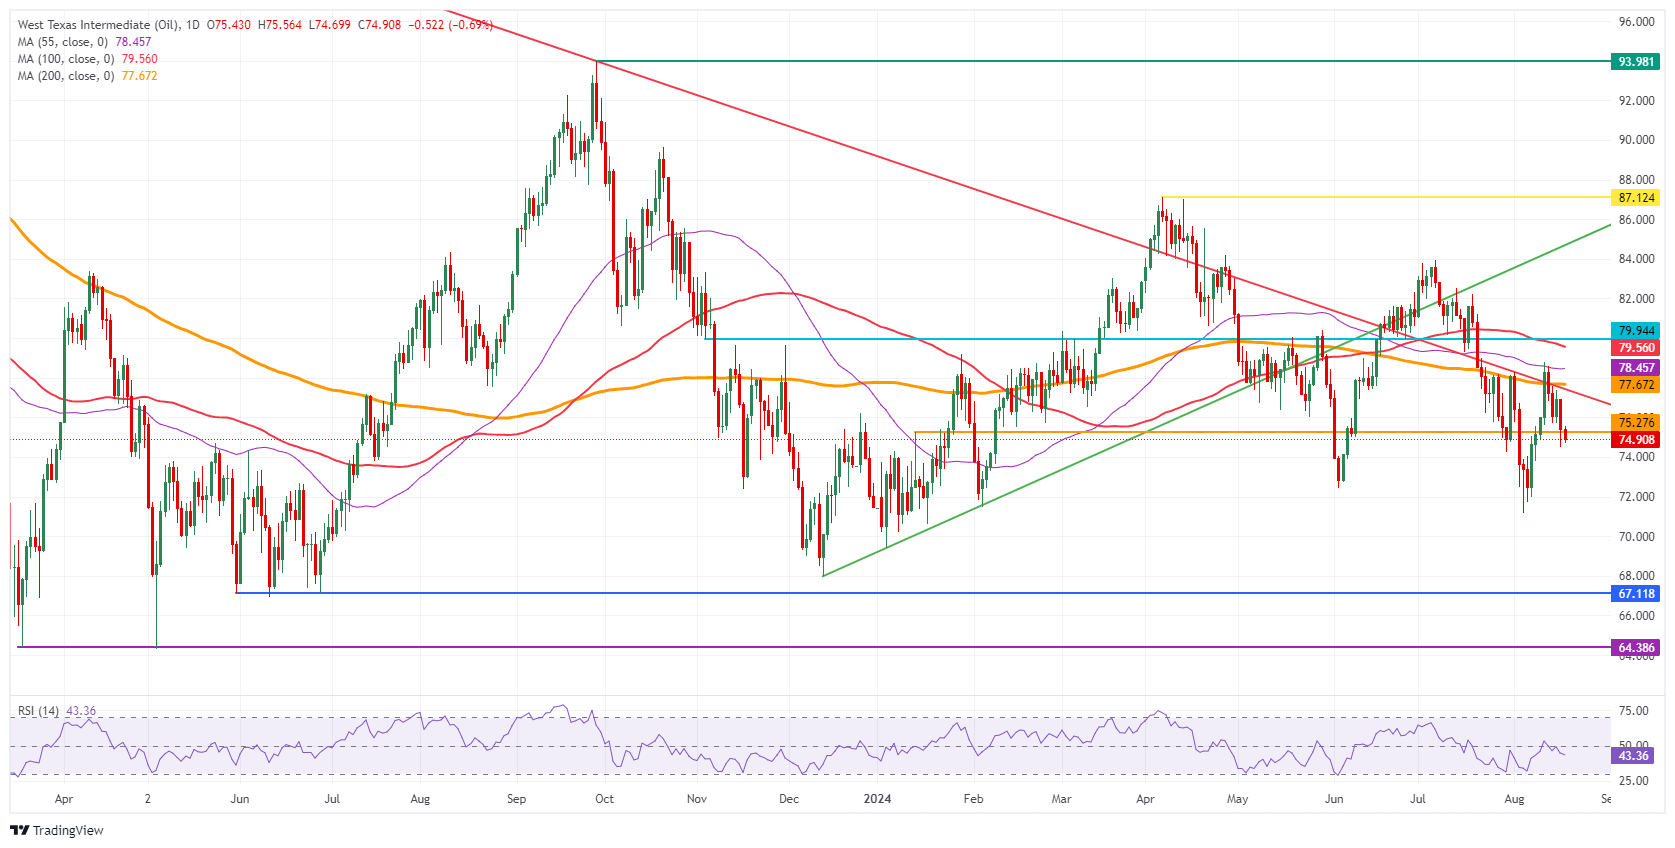
US WTI Crude Oil: Daily Chart
WTI Oil FAQs
WTI Oil is a type of Crude Oil sold on international markets. The WTI stands for West Texas Intermediate, one of three major types including Brent and Dubai Crude. WTI is also referred to as “light” and “sweet” because of its relatively low gravity and sulfur content respectively. It is considered a high quality Oil that is easily refined. It is sourced in the United States and distributed via the Cushing hub, which is considered “The Pipeline Crossroads of the World”. It is a benchmark for the Oil market and WTI price is frequently quoted in the media.
Like all assets, supply and demand are the key drivers of WTI Oil price. As such, global growth can be a driver of increased demand and vice versa for weak global growth. Political instability, wars, and sanctions can disrupt supply and impact prices. The decisions of OPEC, a group of major Oil-producing countries, is another key driver of price. The value of the US Dollar influences the price of WTI Crude Oil, since Oil is predominantly traded in US Dollars, thus a weaker US Dollar can make Oil more affordable and vice versa.
The weekly Oil inventory reports published by the American Petroleum Institute (API) and the Energy Information Agency (EIA) impact the price of WTI Oil. Changes in inventories reflect fluctuating supply and demand. If the data shows a drop in inventories it can indicate increased demand, pushing up Oil price. Higher inventories can reflect increased supply, pushing down prices. API’s report is published every Tuesday and EIA’s the day after. Their results are usually similar, falling within 1% of each other 75% of the time. The EIA data is considered more reliable, since it is a government agency.
OPEC (Organization of the Petroleum Exporting Countries) is a group of 13 Oil-producing nations who collectively decide production quotas for member countries at twice-yearly meetings. Their decisions often impact WTI Oil prices. When OPEC decides to lower quotas, it can tighten supply, pushing up Oil prices. When OPEC increases production, it has the opposite effect. OPEC+ refers to an expanded group that includes ten extra non-OPEC members, the most notable of which is Russia.
Author

Filip Lagaart
FXStreet
Filip Lagaart is a former sales/trader with over 15 years of financial markets expertise under its belt.


