Oil stretches above $81 and tries to stage a technical breakout
- Oil continous to lock in $80 on Thursday, setting forth another profitable weekly performance.
- Traders keep prices supported as tensions in the Middle East intensify.
- The US Dollar Index trades back around 105.50 amid rising safe-haven inflows.

Oil price is looking bullish for a second week in a row and holds above $80 on Thursday after tensions in the Middle East are mounting again. On Tuesday, Israel signed off on plans to launch a Lebanon offensive with the motivation of trying to wipe out Hezbollah. Meanwhile, a Greek freight ship sank on Wednesday after Houthi rebels attacked it with a drone in the Red Sea.
Meanwhile, the US Dollar Index (DXY) is trading back near 105.50 after some easing earlier this week on the back of weak US Retail Sales data for May. The Greenback is picking up power, though, on Thursday, as markets are concerned after the People’s Bank of China (PBoC) let loose its overnight Yuan fixing against the Greenback, opening up for some devaluation against the US Dollar. Markets are picking this up as a sign of concern about more easing and interventions from PBoC.
At the time of writing, Crude Oil (WTI) trades at $81.09 and Brent Crude at $85.03
Oil news and market movers: Mediterranean market faces uptick
- Bloomberg news reports narrowing spreads in the Mediterranean Oil market versus Brent prices. The discount is now only $1.80 per barrel against $3.30 two weeks ago.
- Houthi rebels have sunk a Greek freight ship in the Red Sea by using an unmanned drone missile on Wednesday, Reuters reported.
- For a fourth straight month, China has imported nearly 284,000 tons of Venezuelan crude Oil despite implied US embargoes, Boomberg reports.
- At 15:00 GMT, the US stockpile change for the week ending June 14 from the Energy Information Administration (EIA) will be published. The previous release was a build of 3.73 million barrels, with a drawdown of 2 million expected for this week.
- Tropical storm Alberto is nearing the West Gulf Coast and could cause brief Crude supply disruptions out of the region on the back of it.
Oil Technical Analysis: Market's bullish breakout
Oil price is shooting higher on a mixture of data which tilts to the bullish side. With hurricane season starting to get underway in the US, Houthi rebels sinking a ship in the Red Sea, and Israel set to pursue its military actions by entering Lebanon, traders have a buffet of elements to pick from, which are cause enough to jack up oil prices. Should the EIA print on Thursday show another significant drawdown, crude prices could jump into a new price range, higher.
On the upside, the red descending trend line near $81.00 is the last cap remaining before entering a new price region not seen since April. A break above the trend line would open room for a move back up to $87.12, the year-to-date high (April 5). Previously, a relatively small pivotal level would act as resistance near $84.00.
On the downside, the big belt of Simple Moving Averages (SMA) should work now as support and no longer allow to see moves below it. That means the 55-day SMA at $79.87, the 100-day SMA at $79.39, and the 200-day SMA at $79.03 should no longer see any dips below $79.00. Should those levels not hold, another drop back to $75 could be inevitable.
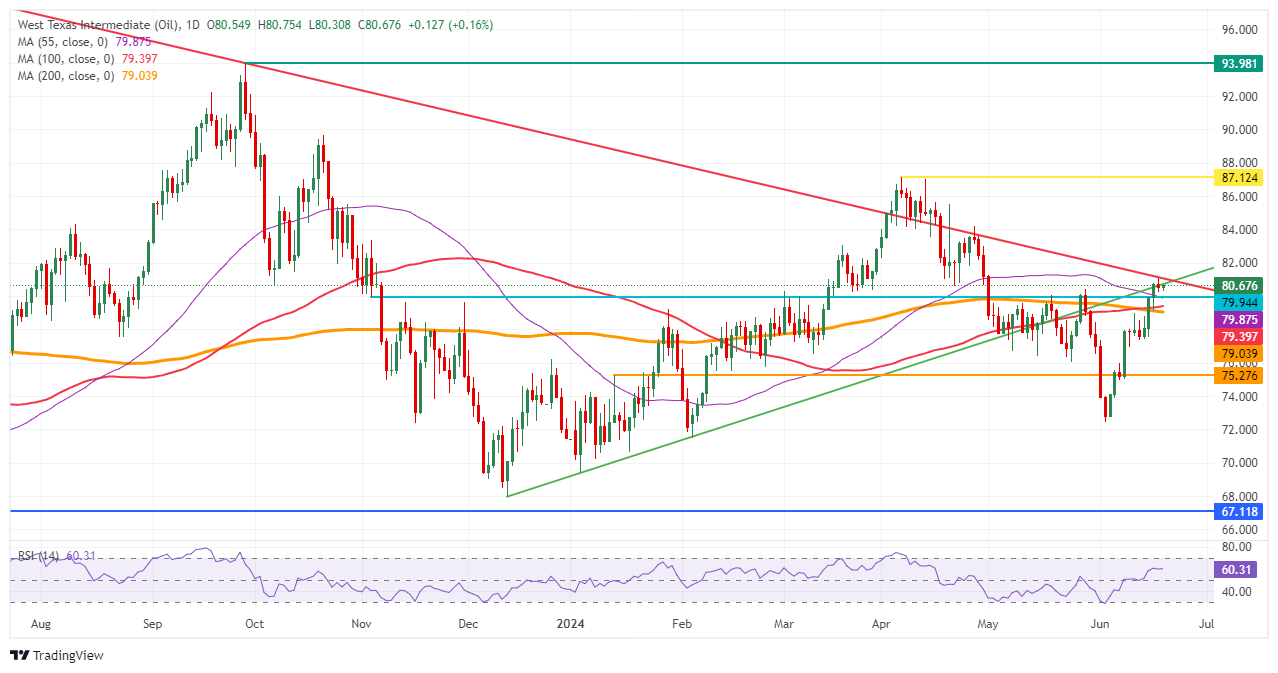
US WTI Crude Oil: Daily Chart
WTI Oil FAQs
WTI Oil is a type of Crude Oil sold on international markets. The WTI stands for West Texas Intermediate, one of three major types including Brent and Dubai Crude. WTI is also referred to as “light” and “sweet” because of its relatively low gravity and sulfur content respectively. It is considered a high quality Oil that is easily refined. It is sourced in the United States and distributed via the Cushing hub, which is considered “The Pipeline Crossroads of the World”. It is a benchmark for the Oil market and WTI price is frequently quoted in the media.
Like all assets, supply and demand are the key drivers of WTI Oil price. As such, global growth can be a driver of increased demand and vice versa for weak global growth. Political instability, wars, and sanctions can disrupt supply and impact prices. The decisions of OPEC, a group of major Oil-producing countries, is another key driver of price. The value of the US Dollar influences the price of WTI Crude Oil, since Oil is predominantly traded in US Dollars, thus a weaker US Dollar can make Oil more affordable and vice versa.
The weekly Oil inventory reports published by the American Petroleum Institute (API) and the Energy Information Agency (EIA) impact the price of WTI Oil. Changes in inventories reflect fluctuating supply and demand. If the data shows a drop in inventories it can indicate increased demand, pushing up Oil price. Higher inventories can reflect increased supply, pushing down prices. API’s report is published every Tuesday and EIA’s the day after. Their results are usually similar, falling within 1% of each other 75% of the time. The EIA data is considered more reliable, since it is a government agency.
OPEC (Organization of the Petroleum Exporting Countries) is a group of 13 Oil-producing nations who collectively decide production quotas for member countries at twice-yearly meetings. Their decisions often impact WTI Oil prices. When OPEC decides to lower quotas, it can tighten supply, pushing up Oil prices. When OPEC increases production, it has the opposite effect. OPEC+ refers to an expanded group that includes ten extra non-OPEC members, the most notable of which is Russia.
Author

Filip Lagaart
FXStreet
Filip Lagaart is a former sales/trader with over 15 years of financial markets expertise under its belt.


