Oil locks in 1.5% gains ahead of Fed's Powell speech
- Oil pops to $74.00 with expectations of OPEC acting, taking place.
- Morgan Stanley cuts its Brent Oil price forecast by $5 to $80 per barrel for the end of 2024.
- The US Dollar Index hovers around 101.00 ahead of Fed Chairman Powell's speech.

Oil prices are rebounding slightly on Friday, extending Thursday’s gains after snapping the losing streak for this week. The rebound, however, could be short-lived as the price outlook remains clouded by concerns over demand and a vast supply surplus at hand if OPEC does not alter the upcoming unwinding of production cuts. OPEC is caught between a rock and a hard place, because sticking to their earlier commitments makes the cartel creditworthy, while coming back on previous statements would make markets less compelled to listen to any further communication from OPEC, and therefore losing grip on Oil pricing.
The US Dollar Index (DXY), which tracks the performance of the US Dollar against six major currencies, is facing a moment of truth. The annual Jackson Hole Symposium gets underway with the main event being a speech by US Federal Reserve Chairman Jerome Powell. The speech has a lot of weight as it is seen as a market-moving and policy-changing event, outside of the scheduled Fed policy meetings.
At the time of writing, Crude Oil (WTI) trades at $74.00 and Brent Crude at $77.61
Oil news and market movers: OPEC needs to make a move
- Bloomberg Analytics reports that the Oil market has little room to process additional OPEC barrels that will be released onto markets once the production cuts have been lifted.
- Morgan Stanley issued a report this Friday trimming its forecast to $80 per barrel for Brent Crude, down $5 previously expected. Global demand growth is set to diminish as well from 1.1 million barrels per day from 1.2 million barrels due to sluggish Chinese demand.
- Near 17:00 GMT, the Baker Hughes Oil rig count is to be released. The previous count came in at 483, with no forecast available.
- US Federal Reserve Chairman Jerome Powell is set to speak at 14:00 GMT. His speech will be released at that time while he will be taking the stage.
Oil Technical Analysis: Is Oil a sign on the wall for DXY?
Oil not only snaps this week’s losing streak, it also breaks up its correlation with the US Dollar Index (DXY) that markets have seen in the past few days. While the DXY is rather sideways to lower for this Friday, Crude price is popping higher by 1%. This renewed enthusiasm among Oil traders should be taken with a pinch of salt considering the medium-term outlook, but at least it is helping Oil to avoid a decline below $70.00 for now.
On the upside, it becomes very difficult to be bullish with a lot of resistance levels nearby. The first element to look out for is the pivotal $75.27. Next up is the double level at $77.65, which aligns with both a descending trendline and the 200-day Simple Moving Average (SMA). In case bulls are able to break above it, the 100-day SMA at $78.45 could trigger a rejection.
On the downside, the low from August 5 at $71.17 is working its magic as it was able to eke out this bounce that now enters its second day of existence. Under $70.00, the $68.00 big figure is the first level to watch followed by $67.11, which is the lowest point from the triple bottom seen back in June 2023.
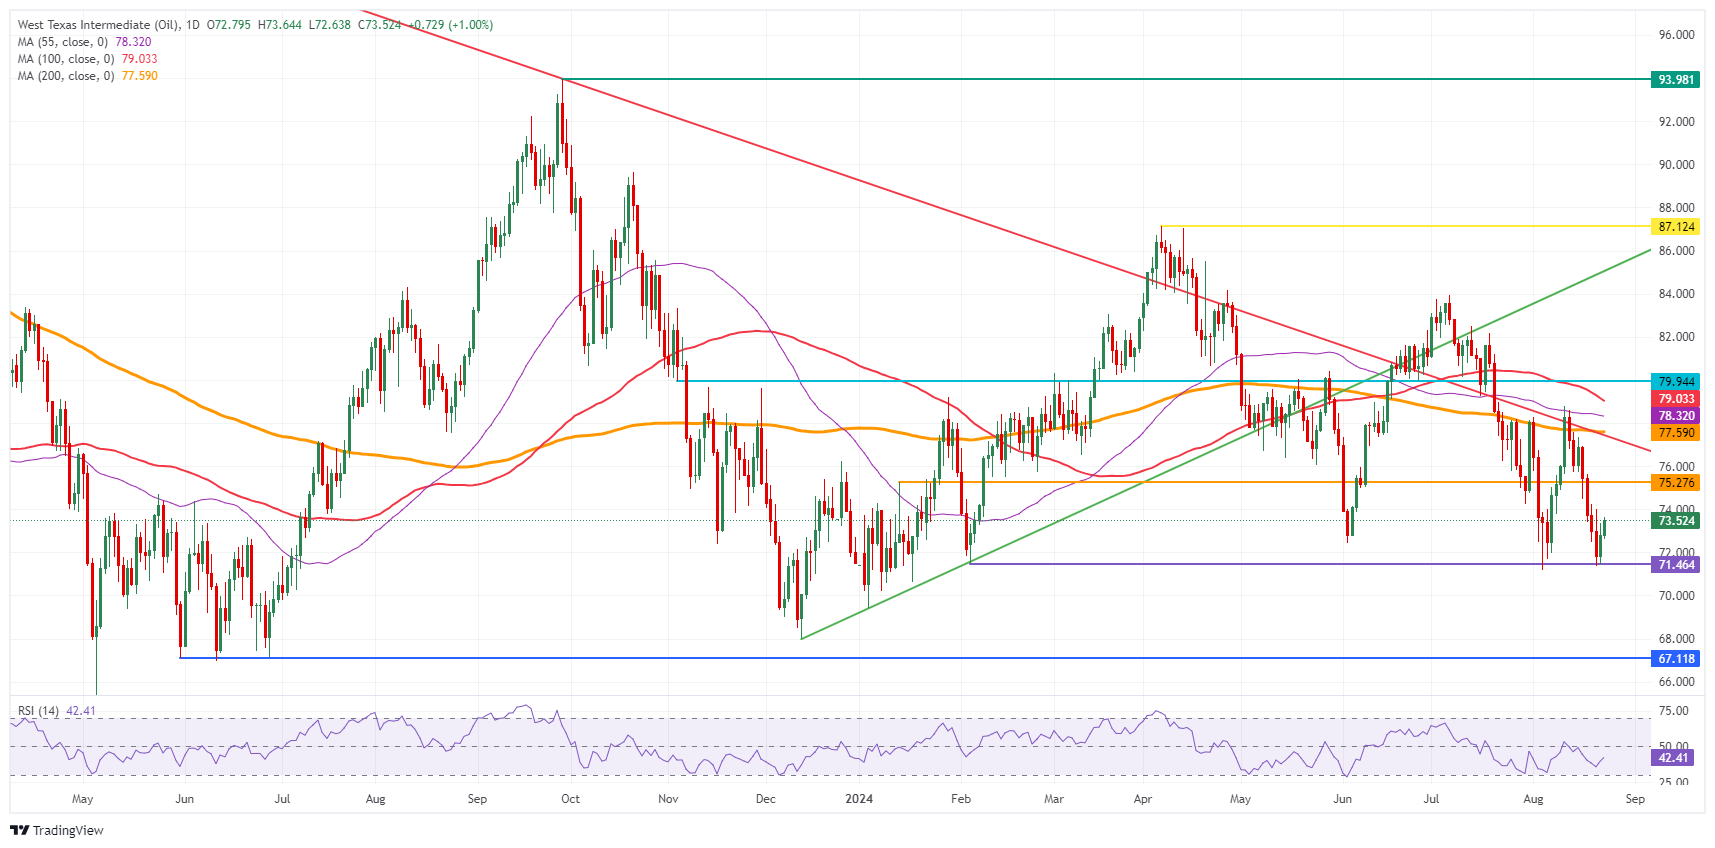
US WTI Crude Oil: Daily Chart
WTI Oil FAQs
WTI Oil is a type of Crude Oil sold on international markets. The WTI stands for West Texas Intermediate, one of three major types including Brent and Dubai Crude. WTI is also referred to as “light” and “sweet” because of its relatively low gravity and sulfur content respectively. It is considered a high quality Oil that is easily refined. It is sourced in the United States and distributed via the Cushing hub, which is considered “The Pipeline Crossroads of the World”. It is a benchmark for the Oil market and WTI price is frequently quoted in the media.
Like all assets, supply and demand are the key drivers of WTI Oil price. As such, global growth can be a driver of increased demand and vice versa for weak global growth. Political instability, wars, and sanctions can disrupt supply and impact prices. The decisions of OPEC, a group of major Oil-producing countries, is another key driver of price. The value of the US Dollar influences the price of WTI Crude Oil, since Oil is predominantly traded in US Dollars, thus a weaker US Dollar can make Oil more affordable and vice versa.
The weekly Oil inventory reports published by the American Petroleum Institute (API) and the Energy Information Agency (EIA) impact the price of WTI Oil. Changes in inventories reflect fluctuating supply and demand. If the data shows a drop in inventories it can indicate increased demand, pushing up Oil price. Higher inventories can reflect increased supply, pushing down prices. API’s report is published every Tuesday and EIA’s the day after. Their results are usually similar, falling within 1% of each other 75% of the time. The EIA data is considered more reliable, since it is a government agency.
OPEC (Organization of the Petroleum Exporting Countries) is a group of 13 Oil-producing nations who collectively decide production quotas for member countries at twice-yearly meetings. Their decisions often impact WTI Oil prices. When OPEC decides to lower quotas, it can tighten supply, pushing up Oil prices. When OPEC increases production, it has the opposite effect. OPEC+ refers to an expanded group that includes ten extra non-OPEC members, the most notable of which is Russia.
Author

Filip Lagaart
FXStreet
Filip Lagaart is a former sales/trader with over 15 years of financial markets expertise under its belt.


