|

NZD/USD technical analysis: Little reaction to New Zealand current account data

  • Higher than expected current account balance falls short to please buyers amid lesser than forecast current account to GDP ratio.
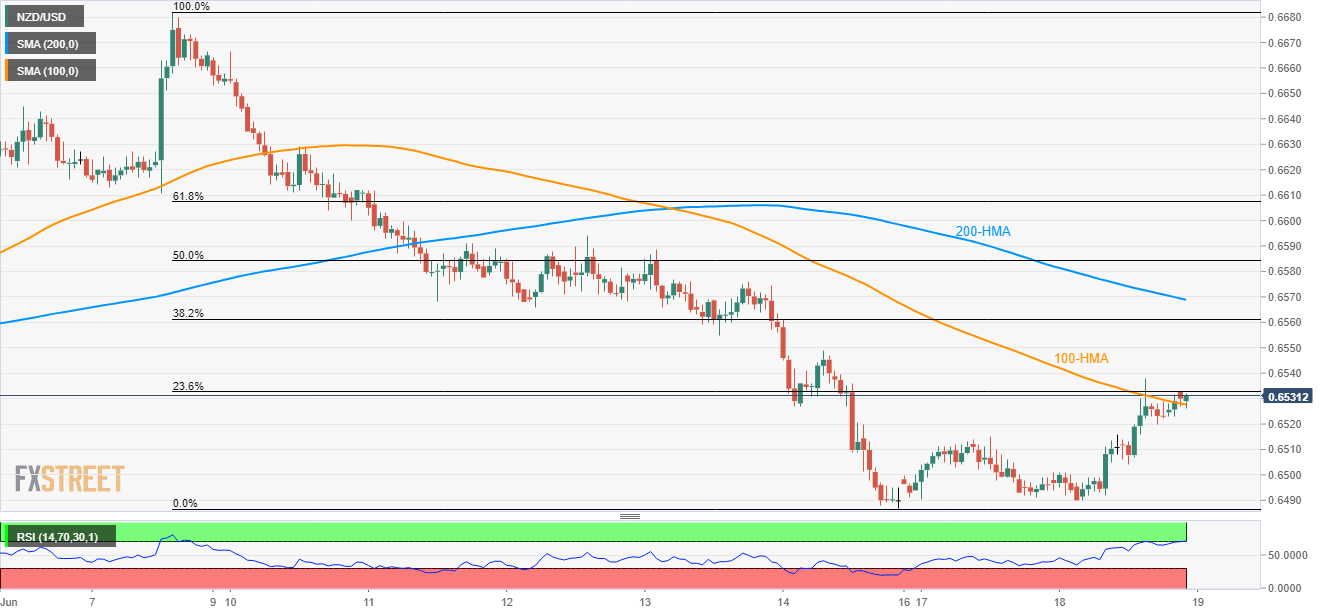
  • Overbought RSI indicates pullback but 100-HMA holds the downside capped.

The NZD/USD pair showed little reaction to first quarter current account data while trading near 0.6530 during early Wednesday.

The Q1 2019 current account balance grew past $0.526 billion forecast and $-3.256 billion prior to $0.675 billion. However, the decline in the current account – GDP ratio to -3.6% versus -3.5% expected capped the Kiwi traders’ optimism.

The pair struggles between a small area occupied by the 100-hour moving average (HMA) and 23.6% Fibonacci retracement of its 12-day decline.

While an upside clearance of 0.6533 can propel the pair towards 0.6550 and then to 200-HMA level of 0.6570, 0.6515 and 0.6500 may entertain sellers past-0.6525 break.

Considering overbought conditions of 14-bar relative strength index (RSI), chances of its pullback are brighter. In that case, the latest low surrounding 0.6487 and May month bottom around 0.6480 seem the key for bears.

Alternatively, an upside break of 0.6570 might not refrain from calling 0.6600 and 61.8% Fibonacci retracement level of 0.6608 back to the chart.

NZD/USD hourly chart

Trend: Pullback expected

    1. R3 0.6534
    2. R2 0.6524
    3. R1 0.6509
  1. PP 0.65
    1. S1 0.6485
    2. S2 0.6476
    3. S3 0.646

Author

Anil Panchal

Anil Panchal

FXStreet

Anil Panchal has nearly 15 years of experience in tracking financial markets. With a keen interest in macroeconomics, Anil aptly tracks global news/updates and stays well-informed about the global financial moves and their implications.

More from Anil Panchal
Share:

Editor's Picks

EUR/USD accelerates losses, focus is on 1.1800

EUR/USD’s selling pressure is gathering pace now, opening the door to a potential test of the key 1.1800 region sooner rather than later. The pair’s pullback comes on the back of marked gains in the US Dollar following US data releases and the publication of the FOMC Minutes later in the day.

GBP/USD turns negative near 1.3540

GBP/USD reverses its initial upside momentum and is now adding to previous declines, revisiting at the same time the 1.3540 region on Wednesday. Cable’s downtick comes on the back of decent gains in the Greenback and easing UK inflation figures, which seem to have reinforced the case for a BoE rate cut in March.

Gold picks pace, flirts with $5,000

Gold is back on the front foot on Wednesday, shaking off part of the early week softness and pushing higher towards the key $5,000 mark per troy ounce. The move comes ahead of the FOMC Minutes and is unfolding despite an intense rebound in the US Dollar.

Fed Minutes to shed light on January hold decision amid hawkish rate outlook

The Minutes of the Fed’s January 27-28 monetary policy meeting will be published today. Details of discussions on the decision to leave the policy rate unchanged will be scrutinized by investors.

Mixed UK inflation data no gamechanger for the Bank of England

Food inflation plunged in January, but service sector price pressure is proving stickier. We continue to expect Bank of England rate cuts in March and June. The latest UK inflation read is a mixed bag for the Bank of England, but we doubt it drastically changes the odds of a March rate cut.

Sui extends sideways action ahead of Grayscale’s GSUI ETF launch

Sui is extending its downtrend for the second consecutive day, trading at 0.95 at the time of writing on Wednesday. The Layer-1 token is down over 16% in February and approximately 34% from the start of the year, aligning with the overall bearish sentiment across the crypto market.