|

NZD/USD Price Forecast: Falling in possible C wave of bearish pattern

  • NZD/USD is steadily declining in what could be the final wave of a large zig-zag pattern. 
  • It is not yet oversold and could reach lower lows given the bearish short and medium-term trends. 

NZD/USD is falling in what might be the C wave of a bearish ABC pattern which began life at the September 30 highs.

ABCs are zig-zag patterns in which waves A and C are usually of a similar length or a Fibonacci 61.8% of the other.

NZD/USD Daily Chart 


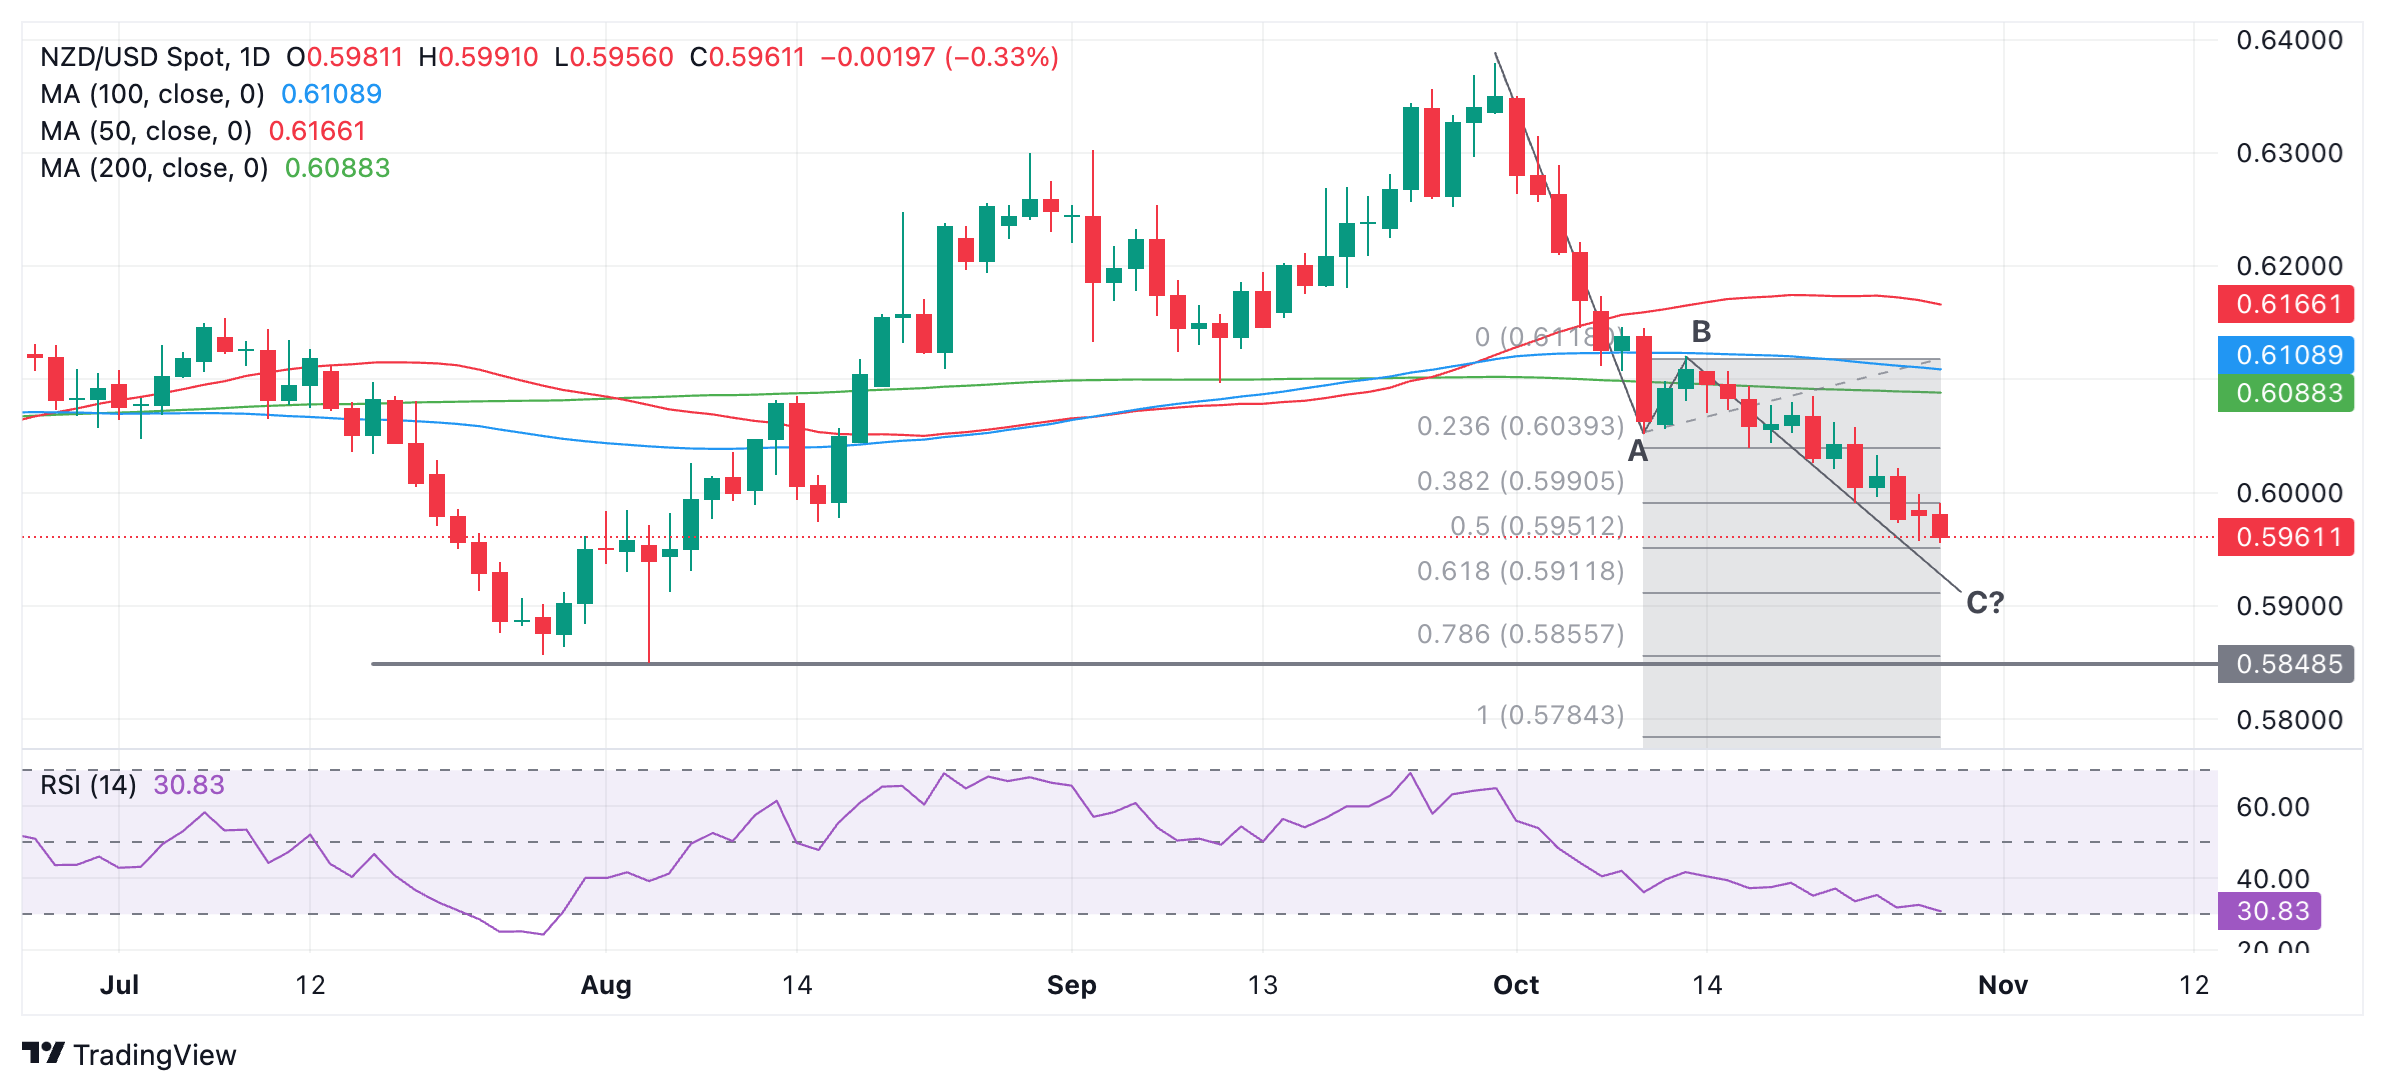
NZD/USD will probably fall to a target at 0.5911, the point where wave C is 61.8% of A. A break below the 0.5956 low would provide confirmation. 

It is possible it could fall all the way to the major support level at 0.5849 (August 5 low). A really bearish move could even see an extension to 0.5784, the point where wave C = A.

The outlook is supported by the fact that the pair is in a bearish short and medium-term downtrend and “the trend is your friend”. The Kiwi pair is, however, in a sideways long-term consolidation. 

The Relative Strength Index (RSI) momentum indicator is not yet oversold (below 30) suggesting there could be more downside to come. When it reaches oversold traders will be advised to not add to their existing short positions. 

Author

Joaquin Monfort

Joaquin Monfort is a financial writer and analyst with over 10 years experience writing about financial markets and alt data. He holds a degree in Anthropology from London University and a Diploma in Technical analysis.

More from Joaquin Monfort
Share:

Editor's Picks

EUR/USD keeps the rangebound trade near 1.1850

EUR/USD is still under pressure, drifting back towards the 1.1850 area as Monday’s session draws to a close. The modest decline in spot comes as the US Dollar picks up a bit of support, while thin liquidity and muted volatility, thanks to the US market holiday, are exaggerating price swings and keeping trading conditions choppy.
 

GBP/USD flirts with daily lows near 1.3630

GBP/USD has quickly given back Friday’s solid gains, turning lower at the start of the week and drifting back towards the 1.3630 area. The focus now shifts squarely to Tuesday’s UK labour market report, which is likely to keep the quid firmly in the spotlight and could set the tone for Cable’s next move.

Gold battle around $5,000 continues

Gold is giving back part of Friday’s sharp rebound, deflating below the key $5,000 mark per troy ounce as the new week gets underway. Modest gains in the US Dollar are keeping the metal in check, while thin trading conditions, due to the Presidents Day holiday in the US, are adding to the choppy and hesitant tone across markets.

AI Crypto Update: Bittensor eyes breakout as AI tokens falter 

The artificial intelligence (AI) cryptocurrency segment is witnessing heightened volatility, with top tokens such as Near Protocol (NEAR) struggling to gain traction amid the persistent decline in January and February.

The week ahead: Key inflation readings and why the AI trade could be overdone

It is likely to be a quiet start to the week, with US markets closed on Monday for Presidents Day. European markets are higher across the board and gold is clinging to the $5,000 level after the tamer than expected CPI report in the US reduced haven flows to precious metals.

XRP steadies in narrow range as fund inflows, futures interest rise

Ripple is trading in a narrow range between $1.45 (immediate support) and $1.50 (resistance) at the time of writing on Monday. The remittance token extended its recovery last week, peaking at $1.67 on Sunday from the weekly open at $1.43.