|

NZD/USD Price Analysis: Struggles between 200-day EMA and 0.6190 support

  • NZD/USD struggles to extend two-day recovery moves, sidelined of late.
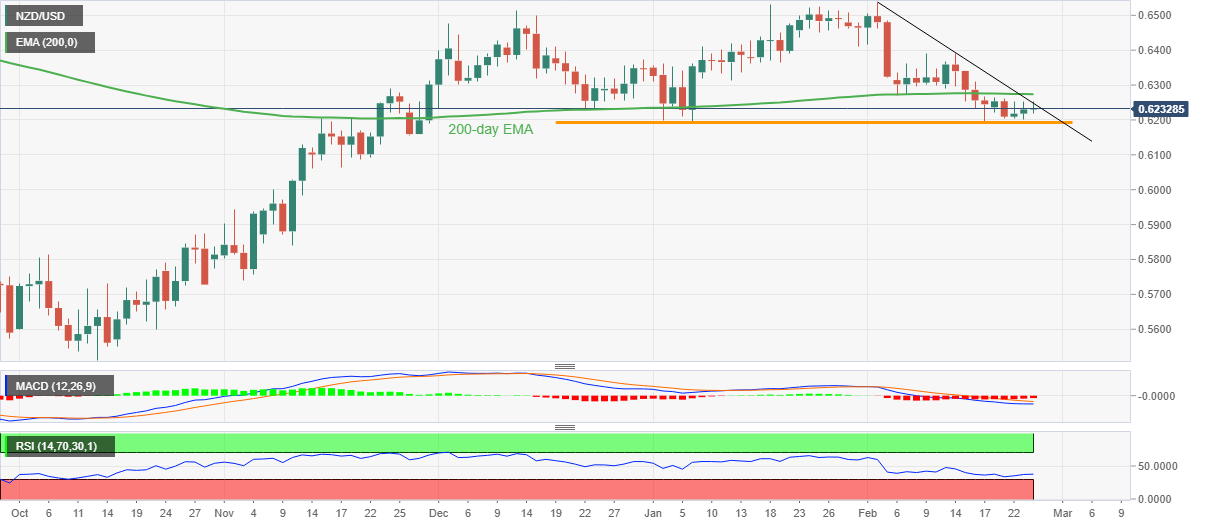
  • Three-week-old descending resistance line guards immediate upside ahead of 200-day EMA.
  • Horizontal area from early January appears strong support to watch amid bearish MACD signals, nearly oversold RSI conditions.

NZD/USD remains defensive near 0.6230, struggling to extend the two-day winning streak during Friday’s Asian session. In doing so, the Kiwi pair grinds with an important trading range amid mixed oscillators.

That said, the quote currently jostles with a downward-sloping resistance line from February 02, close to 0.6250 by the press time, as the RSI (14) line seesaws around the oversold territory while the MACD signals are bearish.

The same suggests that the bearish bias remains intact with the downside room appearing limited.

As a result, a seven-week-old horizontal support area surrounding 0.6190 appears the key for the NZD/USD bears to watch during the quote’s further downside.

It’s worth noting that the Kiwi pair’s downside below 0.6190 could aim for 0.6100 while any further downside will need validation from the mid-November swing low surrounding 0.6060 before poking the 0.6000 threshold.

On the flip side, a daily closing beyond the aforementioned three-week-old resistance line will need to cross the 200-day Exponential Moving Average (EMA) level surrounding 0.6275 to convince the NZD/USD buyers. In that case, a run-up toward the February 14 high near 0.6390 can’t be ruled out.

Overall, NZD/USD is likely to remain bearish but the downside needs validation from 0.6190.

NZD/USD: Daily chart

Trend: Further downside expected

Additional important levels

Overview
Today last price0.623
Today Daily Change-0.0003
Today Daily Change %-0.05%
Today daily open0.6233
 
Trends
Daily SMA200.6334
Daily SMA500.6352
Daily SMA1000.6181
Daily SMA2000.6185
 
Levels
Previous Daily High0.6252
Previous Daily Low0.6202
Previous Weekly High0.6391
Previous Weekly Low0.6193
Previous Monthly High0.6531
Previous Monthly Low0.619
Daily Fibonacci 38.2%0.6233
Daily Fibonacci 61.8%0.6221
Daily Pivot Point S10.6206
Daily Pivot Point S20.6179
Daily Pivot Point S30.6156
Daily Pivot Point R10.6256
Daily Pivot Point R20.6279
Daily Pivot Point R30.6306

Author

Anil Panchal

Anil Panchal

FXStreet

Anil Panchal has nearly 15 years of experience in tracking financial markets. With a keen interest in macroeconomics, Anil aptly tracks global news/updates and stays well-informed about the global financial moves and their implications.

More from Anil Panchal
Share:

Editor's Picks

EUR/USD treads water above 1.1850 amid thin trading

EUR/USD stays defensive but holds 1.1850 amid quiet markets in the European hours on Monday.  The US Dollar is struggling for direction due to thin liquidity conditions as US markets are closed in observance of Presidents' Day. 

GBP/USD flat lines as traders await key UK and US macro data

GBP/USD kicks off a new week on a subdued note and oscillates in a narrow range near 1.365 in Monday's European trading. The mixed fundamental backdrop warrants some caution for aggressive traders as the market focus now shifts to this week's important releases from the UK and the US.

Gold slides below $5,000 amid USD uptick and positive risk tone; downside seems limited

Gold attracts fresh sellers at the start of a new week and reverses a part of Friday's strong move up of over $150 from sub-$4,900 levels. The commodity slides back below the $5,000 psychological mark during the Asian session, though the downside potential seems limited amid a combination of supporting factors.

Bitcoin, Ethereum and Ripple consolidate within key ranges as selling pressure eases

Bitcoin and Ethereum prices have been trading sideways within key ranges following the massive correction. Meanwhile, XRP recovers slightly, breaking above the key resistance zone. The top three cryptocurrencies hint at a potential short-term recovery, with momentum indicators showing fading bearish signs.

Global inflation watch: Signs of cooling services inflation

Realized inflation landed close to expectations in January, as negative base effects weighed on the annual rates. Remaining sticky inflation is largely explained by services, while tariff-driven goods inflation remains limited even in the US.

Ripple Price Forecast: XRP potential bottom could be in sight

Ripple edges up above the intraday low of $1.35 at the time of writing on Friday amid mixed price actions across the crypto market. The remittance token failed to hold support at $1.40 the previous day, reflecting risk-off sentiment amid a decline in retail and institutional sentiment.