NZD/USD Price Analysis: Slides further below 0.6150 amid firm US Dollar
- NZD/USD falls sharply below 0.6150 as investors rush for safe-haven currencies.
- The US Dollar gains sharply as investors see the Fed opting for a 25-bps interest rate cut this month.
- A sharp deflation in China’s PPI weighs on the New Zealand Dollar.

The NZD/USD pair tumbles below 0.6150 in Monday’s European session. The Kiwi asset weakens as the US Dollar (USD) gains strength on expectations that the Federal Reserve (Fed) will start the policy-easing process this month gradually.
The US Dollar Index (DXY), which tracks the Greenback’s value against six major currencies, surges above 101.50. Meanwhile, the market sentiment appears to be asset-specific as risk-sensitive currencies have faced selling pressure, while the appeal of American equities has improved. S&P 500 futures have posted significant gains in the European trading hours, exhibiting a strong risk appetite of investors.
Earlier, market participants remained worried that the Fed could opt for a large interest rate cut in September amid a sharp slowdown in the United States (US) job growth, indicated by the US Nonfarm Payrolls (NFP) report for July, which prompted fears of a recession. However, Friday’s NFP report showed that the labor market health is not as bad as it appeared last month.
On the New Zealand Dollar (NZD) front, slower-than-expected growth in China’s Consumer Price Index (CPI) for August has weighed on the antipodean. China’s annual CPI grew by 0.6%, slower than estimates of 0.7% but came in higher than July’s reading of 0.5%. However, the producer inflation deflated at a robust pace of 1.8%. Weak pricing power in the hands of producers suggests a poor demand environment, which will have a significant impact on China’s economy and its trading partners. The NZ economy, being one of the leading trading partners of China, faces a decline in foreign flows.
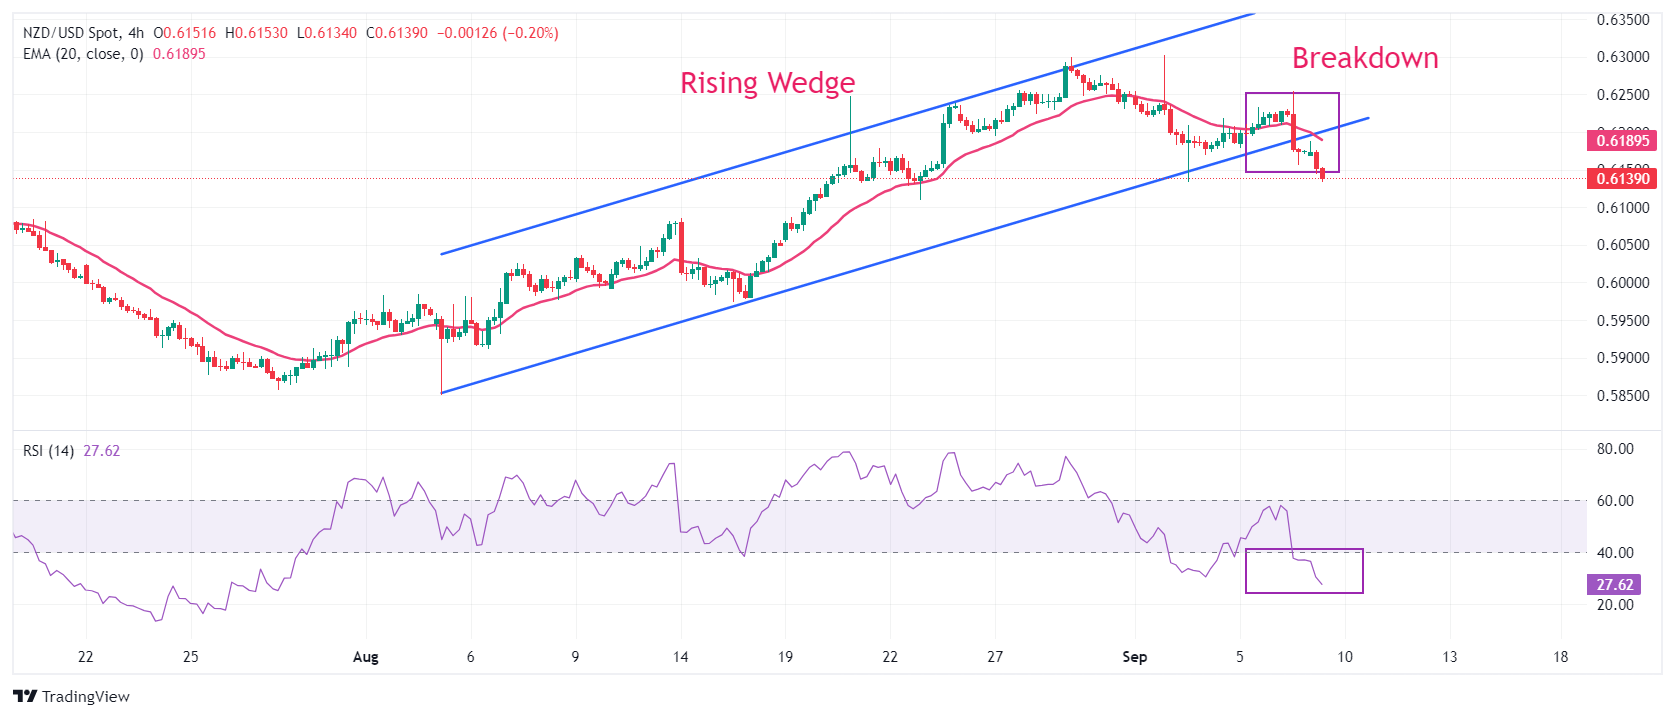
NZD/USD witnessed a steep fall after a breakdown of the Rising Wedge chart formation in a four-hour timeframe, which resulted in a bearish reversal. The 20-period Exponential Moving Average (EMA) at 0.6190 starts declining, suggesting the onset of a bearish trend in the short term.
The 14-period Relative Strength Index (RSI) shifts into the bearish range of 20.00-40.00, indicating that a bearish momentum has been triggered.
More downside would appear if the asset decisively breaks July 17 high near 0.6100. This would push the asset lower to May 3 high at 0.6046 and the psychological support of 0.6000.
In an alternate scenario, an upside move above September 6 high of 0.6250 would drive the asset toward September 2 high of 0.6300, followed by this year high of 0.6330.
NZD/USD daily chart
Economic Indicator
Producer Price Index (YoY)
The Producer Price Index released by the National Bureau of Statistics of China is a measurement of the rate of inflation experienced by producers. It captures the average changes in prices received by Chinese domestic producers of commodities in all stages of processing (crude materials, intermediate materials, and finished goods). Changes in the PPI are widely considered as an indicator of commodity inflation. If the Producer Price Index increase is excesive, it would indicate that inflation has become a destabilizing factor in the economy, The People’s Bank of China would tighten monetary policy and fiscal policy risk. Generally speaking, a high reading is seen as positive (or bullish) for the CNY, whereas a low reading is seen as negative (or bearish) for the CNY.
Read more.Last release: Mon Sep 09, 2024 01:30
Frequency: Monthly
Actual: -1.8%
Consensus: -1.4%
Previous: -0.8%
Author

Sagar Dua
FXStreet
Sagar Dua is associated with the financial markets from his college days. Along with pursuing post-graduation in Commerce in 2014, he started his markets training with chart analysis.


