|

NZD/USD Price Analysis: Prints fresh two-week low around 0.6110 as Chinese economy worsens further

  • NZD/USD has refreshed its two-week low at 0.6113 amid a bleak outlook for China.
  • Investors have turned risk-averse ahead of the speech from Fed Jerome Powell.
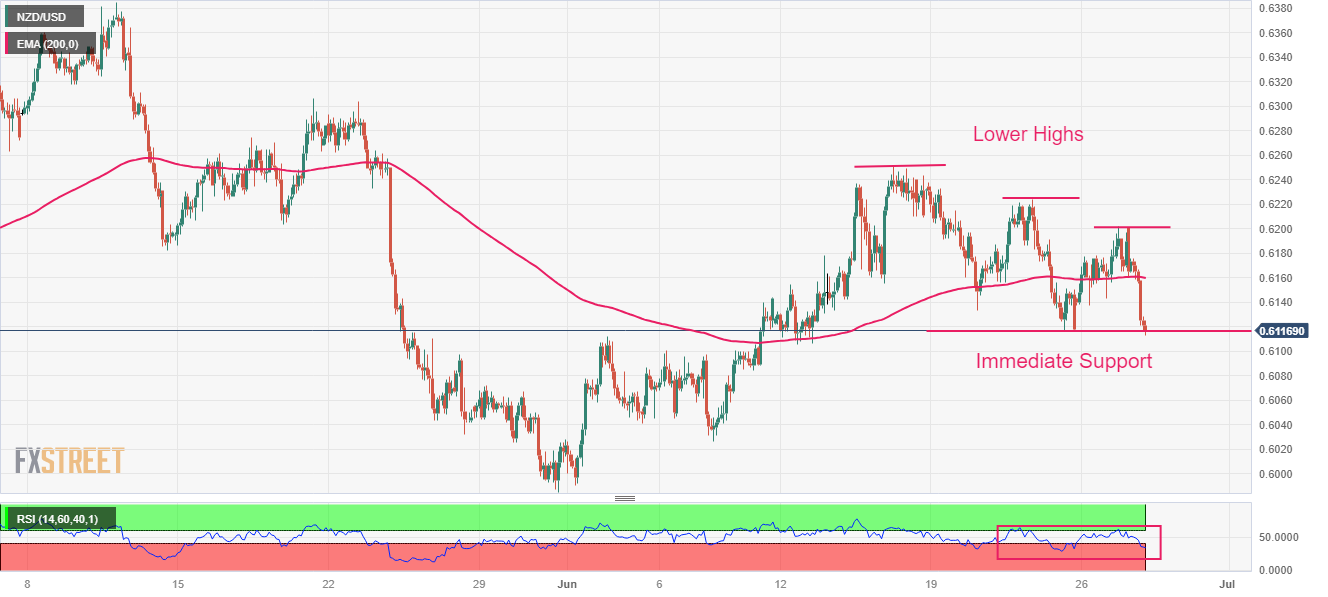
  • NZD/USD is consistently forming lower highs, which indicates that investors are capitalizing on each pullback as a selling opportunity.

The NZD/USD pair has printed a fresh two-week low at 0.6113 in the early European session. More downside in the Kiwi asset is anticipated as Chinese economic prospects are worsening further due to bleak demand and weak exports.

China’s National Bureau of Statistics (NBS) reported that corporate profits contracted 12.6% in May above an 18.2% drop in April due to weak households demand. It is worth noting that New Zealand is one of the leading trading partners of China and the weak economic outlook of China would be weighing pressure on the New Zealand Dollar.

S&P500 futures are showing caution despite a bullish settlement on Tuesday. Investors have turned risk-averse ahead of the speech from Federal Reserve (Fed) chair Jerome Powell to assess the interest rate guidance.

The US Dollar Index (DXY) is struggling to keep stability above the immediate resistance of 102.60.

NZD/USD is consistently forming lower highs on a two-hour scale, which indicates that investors are capitalizing on each pullback as a selling opportunity. The Kiwi asset has been failing to auction above the 200-period Exponential Moving Average (EMA) at 0.6160, which portrays that the long-term trend is bearish.

Action in the Relative Strength Index (RSI) (14) indicates that 60.00 is a barricade and territory below 40.00 is consistently tested. This conveys that the bullish momentum is active.

Further downside below the intraday low at 0.6113 will expose the asset to June 05 low at 0.6041. A slippage below the latter would expose the asset to psychological support at 0.6000.

Alternatively, a confident break above May 17 high at 0.6261 will drive the Kiwi asset toward May 19 high at 0.6306 followed by May 08 high around 0.6360.

NZD/USD two-hour chart
NZD/USD

Overview
Today last price0.6119
Today Daily Change-0.0044
Today Daily Change %-0.71
Today daily open0.6163
 
Trends
Daily SMA200.6135
Daily SMA500.6172
Daily SMA1000.6202
Daily SMA2000.6158
 
Levels
Previous Daily High0.6202
Previous Daily Low0.6143
Previous Weekly High0.6237
Previous Weekly Low0.6116
Previous Monthly High0.6385
Previous Monthly Low0.5985
Daily Fibonacci 38.2%0.6165
Daily Fibonacci 61.8%0.6179
Daily Pivot Point S10.6137
Daily Pivot Point S20.6111
Daily Pivot Point S30.6078
Daily Pivot Point R10.6195
Daily Pivot Point R20.6228
Daily Pivot Point R30.6254

Author

Sagar Dua

Sagar Dua

FXStreet

Sagar Dua is associated with the financial markets from his college days. Along with pursuing post-graduation in Commerce in 2014, he started his markets training with chart analysis.


More from Sagar Dua
Share:

Editor's Picks

GBP/USD clings to recovery gains near 1.3550 after UK CPI data

GBP/USD holds recovery near 1.3550 in European trading hours on Wednesday. The UK annual Consumer Price Index (CPI) inflation picked up to 2.9% in July, meeting estimates, while core CPI rose by 2.6% YoY in July versus 2.5% expected. Mixed UK inflation data failed to provide any impetus to the British Pound.

EUR/USD advances to 1.1600 as USD slips ahead of Fed Minutes

EUR/USD stretches higher toward 1.1600 in Wednesday's European session. The US Dollar resumes its downside as weak US economic data weigh on expectations of tighter Federal Reserve policy. Traders will take further cues from ECB President Christine Lagarde’s speech and the FOMC Minutes later in the day.

Gold climbs back above $4,350 as USD remains depressed ahead of FOMC Minutes

Gold climbs back above $4,350 during the first half of the European session, reversing a part of the previous day's heavy losses. The US Dollar attracts some sellers, and for now seems to have stalled this week's goodish recovery from a two-month low, which is seen as a key factor supporting the commodity. Bulls, however, might opt to wait for more cues about the US Federal Reserve's future policy path before placing fresh directional bets on the non-yielding yellow metal.

Shiba Inu's recovery hinges on key support

Shiba Inu recovers slightly, trading at $0.0000044, after finding support around the critical level earlier this week. The dog-themed meme coin shows improving sentiment as social dominance rises, funding rates turn positive, and bullish traders increase their long positions. On the technical side, SHIB suggests a potential recovery if it holds above the key $0.0000043 level.

Inflation prints and FOMC Minutes take centre stage
In the US, the minutes from the FOMC's July meeting are released this evening. Markets are looking for a more detailed sense of the committee's thinking beyond Kevin Warsh's limited forward guidance. Three participants voted in favour of a hike, and since then, several others have flagged willingness to support a hike if warranted by incoming data.
Why is Crude Oil priced for a reopening the ships haven't made?
Fourteen vessels crossed the Strait of Hormuz on Tuesday. Before the war, the count ran near 120 a day. In the sessions since the waterway was publicly declared open, Brent has drifted back to $87 and West Texas Intermediate (WTI) to $81, both a little lower again on Wednesday, with daily momentum on each unwound from the top of its range in late July to the low twenties now.















