NZD/USD Price Analysis: Posts fresh monthly low after Double Top breakdown
- NZD/USD refreshes monthly low near 0.6076 as the Fed’s hawkish remarks strengthen the US Dollar’s appeal.
- Fed Bowman sees interest rates remaining steady for the entire year.
- A Double Top breakdown weakens the New Zealand Dollar.

The NZD/USD pair posts a fresh monthly low near 0.6076 in Wednesday’s New York session. The Kiwi asset faces intense selling pressure after breaking below the crucial support of 0.6100. The pair weakens as the US Dollar (USD) strengthens due to the Federal Reserve’s (Fed) hawkish remarks on the interest rate outlook.
Fed officials advocate for maintaining interest rates steady until they get evidence that inflation will return to the desired rate of 2%. On Tuesday, Fed Governor Michelle Bowman pushed hopes for rate cuts to next year and warned of further policy tightening if the disinflation process stalls or reverses.
Meanwhile, the CME FedWatch tool shows that traders see the central bank choosing the September meeting as the earliest point to start unwinding the restrictive policy framework.
On the Kiwi front, the Reserve Bank of New Zealand (RBNZ) is expected to keep its Official Cash Rate (OCR) steady at 5.5% for the entire year. The NZ inflation has been declining consistently from last five quarters but is still double the required rate of 2%.
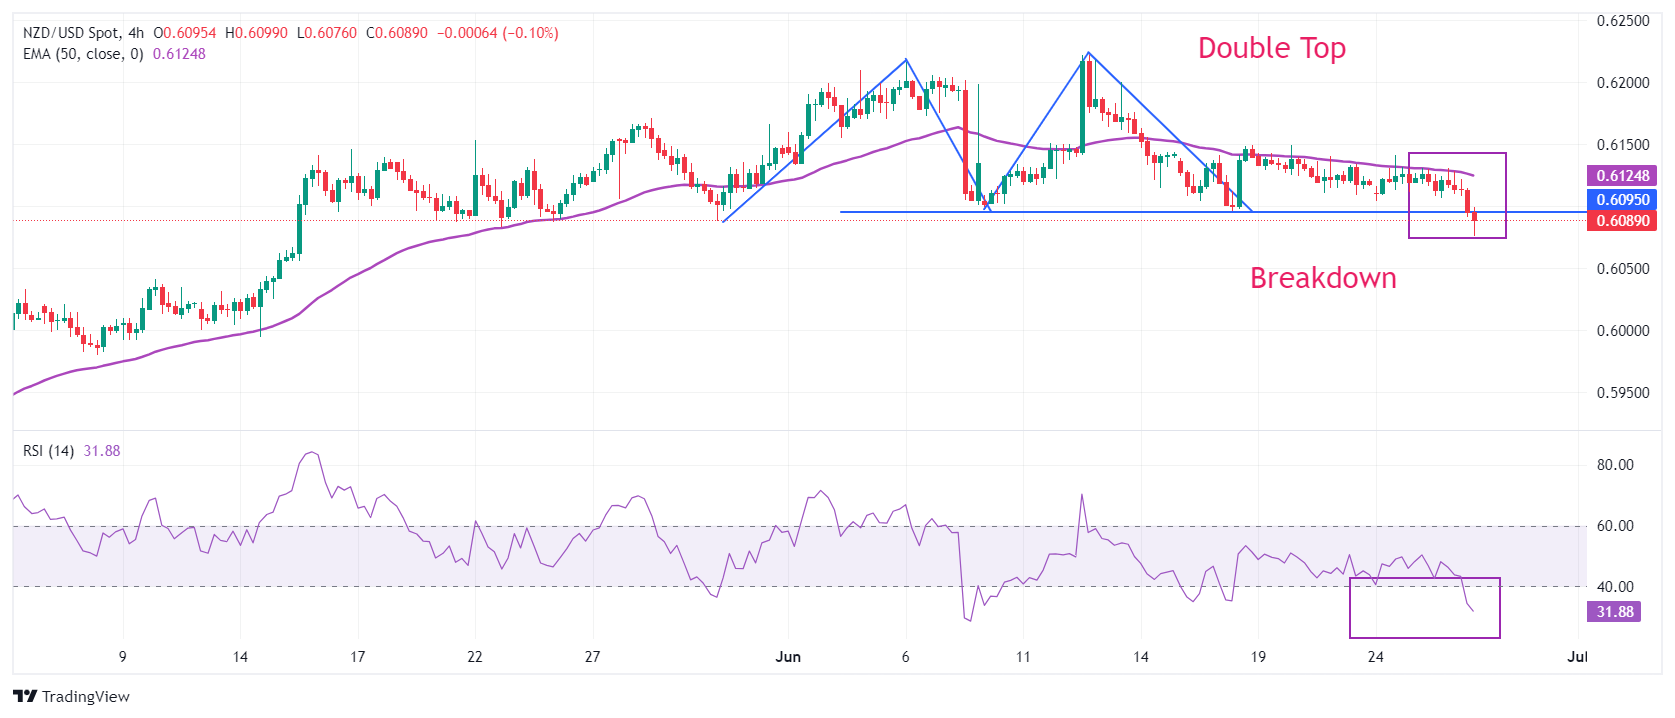
NZD/USD delivers a breakdown of the Double Top chart pattern formed in a four-hour timeframe. The breakdown of the above-mentioned chart pattern triggered after a downside move below the swing low plotted from June 10 low near 0.6100, which results in a bearish reversal.
The 50-period Exponential Moving Average (EMA) near 0.6125 continues to act as a major barricade for the New Zealand Dollar bulls.
The 14-period Relative Strength Index (RSI) falls below 40.00. Should the bearish momentum trigger the oscillator established below the same?
Investors would use a pullback move to near 0.6100 as a selling opportunity for targets near April 4 high around 0.6050 and the psychological support of 0.6000.
On the contrary, a reversal move above June 12 high of 0.6222, which will expose the asset January 15 high near 0.6250, followed by January 12 high near 0.6280.
NZD/USD four-hour chart
Economic Indicator
Consumer Price Index ex Food & Energy (YoY)
Inflationary or deflationary tendencies are measured by periodically summing the prices of a basket of representative goods and services and presenting the data as the Consumer Price Index (CPI). CPI data is compiled on a monthly basis and released by the US Department of Labor Statistics. The YoY reading compares the prices of goods in the reference month to the same month a year earlier. The CPI Ex Food & Energy excludes the so-called more volatile food and energy components to give a more accurate measurement of price pressures. Generally speaking, a high reading is bullish for the US Dollar (USD), while a low reading is seen as bearish.
Read more.Next release: Thu Jul 11, 2024 12:30
Frequency: Monthly
Consensus: -
Previous: 3.4%
Source: US Bureau of Labor Statistics
The US Federal Reserve has a dual mandate of maintaining price stability and maximum employment. According to such mandate, inflation should be at around 2% YoY and has become the weakest pillar of the central bank’s directive ever since the world suffered a pandemic, which extends to these days. Price pressures keep rising amid supply-chain issues and bottlenecks, with the Consumer Price Index (CPI) hanging at multi-decade highs. The Fed has already taken measures to tame inflation and is expected to maintain an aggressive stance in the foreseeable future.
Author

Sagar Dua
FXStreet
Sagar Dua is associated with the financial markets from his college days. Along with pursuing post-graduation in Commerce in 2014, he started his markets training with chart analysis.


