NZD/USD Price Analysis: Kiwi buyers flex muscles despite recent inaction below 0.6300


  • NZD/USD remains depressed inside immediate triangle formation.
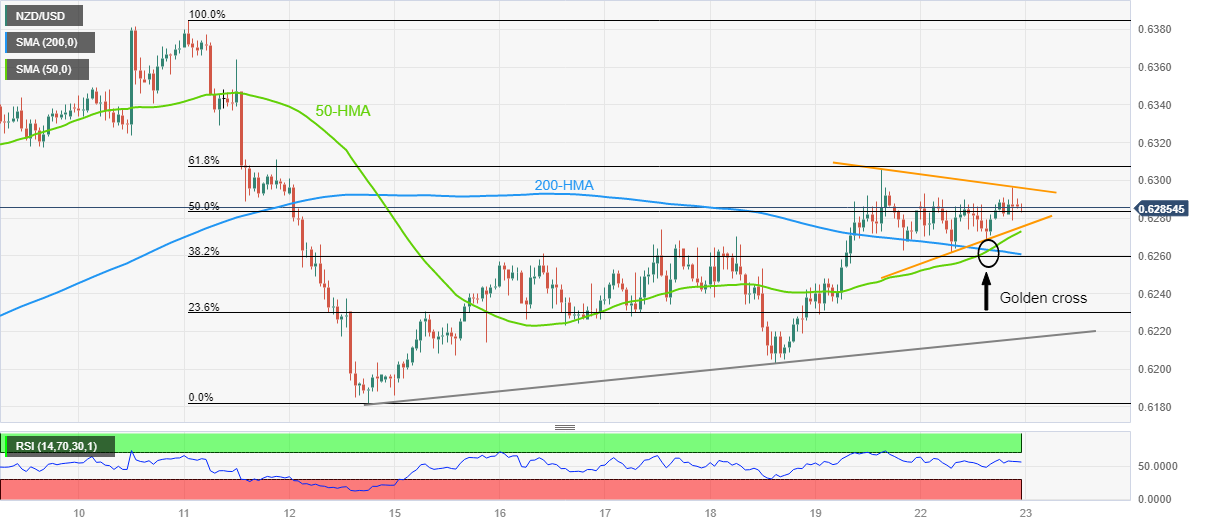
  • Golden cross, steady RSI keeps Kiwi pair buyers hopeful.
  • Bulls need validation from 0.6310 to retake control.

NZD/USD remains mostly steady around 0.6285-80 as it makes rounds inside a symmetrical triangle formation established since the last Friday.

Even so, the Kiwi pair buyers remain hopeful amid the “golden cross” on the hourly chart. That said, the golden cross is a moving average crossover suggesting further upside of the underlying by the 50-SMA’s piercing of the 200-SMA from below.

Apart from the “golden cross”, a steady RSI (14) line also underpins the continuation of a slower grind toward the north.

However, the NZD/USD buyers need to cross the stated triangle’s upper line, around 0.6300 by the press time, for confirmation.

It’s worth noting that the 61.8% Fibonacci retracement level of its May 11-12 downturn, near 0.6310, may act as the final defense of the Kiwi pair sellers before directing the quote towards the monthly high surrounding 0.6385.

On the contrary, a downside break of the stated triangle’s bottom line, close to 0.6275 at the latest, isn’t an open invitation to the NZD/USD bears as 50-SMA and 200-SMA, respectively near 0.6270 and 0.6260, can prod the downside moves.

Following that, the one-week-old ascending support line, close to 0.6215 at the latest, appears the key to watch for the pair sellers to break before taking control.

NZD/USD: Hourly chart

Trend: Further recovery expected

Additional important levels

Overview
Today last price 0.6285
Today Daily Change 0.0163
Today Daily Change % 2.66%
Today daily open 0.6122
 
Trends
Daily SMA20 0.6226
Daily SMA50 0.6228
Daily SMA100 0.6274
Daily SMA200 0.6157
 
Levels
Previous Daily High 0.6306
Previous Daily Low 0.6117
Previous Weekly High 0.6306
Previous Weekly Low 0.6117
Previous Monthly High 0.6389
Previous Monthly Low 0.6111
Daily Fibonacci 38.2% 0.6189
Daily Fibonacci 61.8% 0.6234
Daily Pivot Point S1 0.6058
Daily Pivot Point S2 0.5993
Daily Pivot Point S3 0.5869
Daily Pivot Point R1 0.6246
Daily Pivot Point R2 0.6371
Daily Pivot Point R3 0.6435


Share: Feed news

Information on these pages contains forward-looking statements that involve risks and uncertainties. Markets and instruments profiled on this page are for informational purposes only and should not in any way come across as a recommendation to buy or sell in these assets. You should do your own thorough research before making any investment decisions. FXStreet does not in any way guarantee that this information is free from mistakes, errors, or material misstatements. It also does not guarantee that this information is of a timely nature. Investing in Open Markets involves a great deal of risk, including the loss of all or a portion of your investment, as well as emotional distress. All risks, losses and costs associated with investing, including total loss of principal, are your responsibility. The views and opinions expressed in this article are those of the authors and do not necessarily reflect the official policy or position of FXStreet nor its advertisers. The author will not be held responsible for information that is found at the end of links posted on this page.

If not otherwise explicitly mentioned in the body of the article, at the time of writing, the author has no position in any stock mentioned in this article and no business relationship with any company mentioned. The author has not received compensation for writing this article, other than from FXStreet.

FXStreet and the author do not provide personalized recommendations. The author makes no representations as to the accuracy, completeness, or suitability of this information. FXStreet and the author will not be liable for any errors, omissions or any losses, injuries or damages arising from this information and its display or use. Errors and omissions excepted.

The author and FXStreet are not registered investment advisors and nothing in this article is intended to be investment advice.

Recommended content


Recommended content

Editors’ Picks

AUD/USD drifts lower ahead of Aussie employment details

AUD/USD drifts lower ahead of Aussie employment details

AUD/USD trades with a negative bias above the 0.6500 mark, and over a one-week low touched on Wednesday, as traders await the Australian jobs report for fresh impetus. In the meantime, bets that the Fed will keep rates higher for longer revive the US Dollar demand following the previous day's good two-way price swings and weigh on the currency pair.

USD/JPY retakes 148.00 amid reduced BoJ rate hike bets

USD/JPY retakes 148.00 amid reduced BoJ rate hike bets

USD/JPY builds on the overnight goodish rebound from sub-147.00 levels and gains some positive traction during the Asian session on Thursday. Bets that the BoJ would hold off raising interest rates and disappointing Trade Balance data from Japan weigh on the Japanese Yen amid a bullish market sentiment. Furthermore, renewed US Dollar buying lends support to the currency pair.

Gold price ticks lower amid reduced safe-haven buying, modest USD strength

Gold price ticks lower amid reduced safe-haven buying, modest USD strength

Gold price moves further away from a three-week high touched on Wednesday amid fading safe-haven demand. Moreover, bets that the Fed would delay cutting interest rates amid inflation concerns and the emergence of fresh US Dollar buying weigh on the bullion. However, trade-related uncertainties could offer some support to the XAU/USD ahead of US macro data.

Australia unemployment rate expected to hold steady in June

Australia unemployment rate expected to hold steady in June

Australia is set to release the June employment report at 1:30 GMT. The Australian Bureau of Statistics is expected to announce that the country added 20,000 new job positions in the month, reversing the 2,500 lost positions announced in May.

China’s first-half growth remains on track, though activity data signals caution

China’s first-half growth remains on track, though activity data signals caution

China's second-quarter GDP beat forecasts again with a 5.2% year-on-year growth, driven by strong trade and industrial production. Yet sharper-than-expected slowdowns in fixed-asset investment and retail sales and falling property prices are a concern.

Best Brokers for EUR/USD Trading

Best Brokers for EUR/USD Trading

SPONSORED Discover the top brokers for trading EUR/USD in 2025. Our list features brokers with competitive spreads, fast execution, and powerful platforms. Whether you're a beginner or an expert, find the right partner to navigate the dynamic Forex market.

Forex MAJORS

Cryptocurrencies

Signatures

Best Brokers of 2025