NZD/USD Price Analysis: Keeps Fed-inspired bounce off fortnight-long support above 0.6200


  • NZD/USD prints mild gains after bouncing off two-week-old ascending support line.
  • Bullish MACD signals, steady RSI (14) joins sustained trading beyond 200-DMA to favor bulls.
  • 100-DMA, 50-DMA restrict short-term upside before mid-February high.
  • Bears need validation from 0.6130 before challenging monthly low.

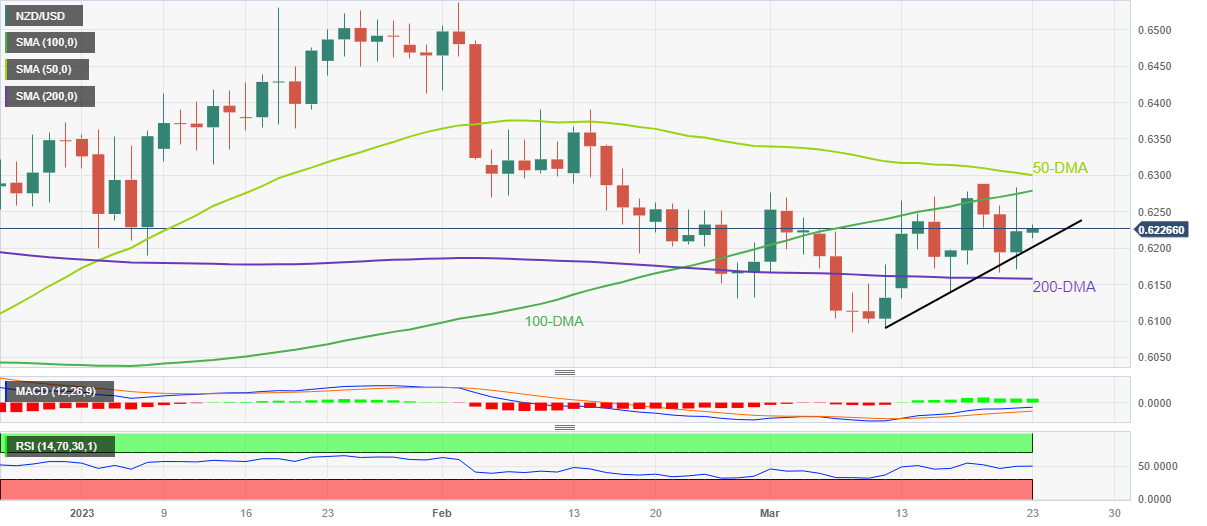
NZD/USD grinds higher past 0.6200, mildly bid near 0.6225 during early Thursday, as it defends the Federal Reserve (Fed) inspired gains despite the latest pullback from the 100-DMA.

In doing so, the Kiwi pair stays firmer above a fortnight-long support line, as well as the 200-DMA. Adding strength to the upside bias could be the bullish MACD signals and the firmer RSI (14).

As a result, the NZD/USD price is likely to mark another attempt in crossing the 100-DMA hurdle of 0.6280, which in turn will highlight the 50-DMA resistance surrounding the 0.6300 threshold for the Kiwi pair buyers.

In a case where the quote remains firmer past 0.6300, the odds of its run-up towards challenging the mid-February high of near 0.6390 and then to the 0.6400 round figure can’t be ruled out.

Alternatively, NZD/USD pullback remains elusive unless the quote stays beyond the aforementioned immediate support line, close to 0.6200 by the press time.

Following that, the 200-DMA level of 0.6158 and the 0.6130 level may act as the last defenses of the buyers before directing the quote toward the monthly low of 0.6084.

Overall, NZD/USD is likely to grind higher but the road toward the north appears bumpy.

NZD/USD: Daily chart

Trend: Further recovery expected

Additional important levels

Overview
Today last price 0.6227
Today Daily Change 0.0033
Today Daily Change % 0.53%
Today daily open 0.6194
 
Trends
Daily SMA20 0.6193
Daily SMA50 0.6306
Daily SMA100 0.6271
Daily SMA200 0.6162
 
Levels
Previous Daily High 0.6258
Previous Daily Low 0.6167
Previous Weekly High 0.6278
Previous Weekly Low 0.6131
Previous Monthly High 0.6538
Previous Monthly Low 0.6131
Daily Fibonacci 38.2% 0.6202
Daily Fibonacci 61.8% 0.6223
Daily Pivot Point S1 0.6155
Daily Pivot Point S2 0.6115
Daily Pivot Point S3 0.6064
Daily Pivot Point R1 0.6246
Daily Pivot Point R2 0.6297
Daily Pivot Point R3 0.6337


Share: Feed news

Information on these pages contains forward-looking statements that involve risks and uncertainties. Markets and instruments profiled on this page are for informational purposes only and should not in any way come across as a recommendation to buy or sell in these assets. You should do your own thorough research before making any investment decisions. FXStreet does not in any way guarantee that this information is free from mistakes, errors, or material misstatements. It also does not guarantee that this information is of a timely nature. Investing in Open Markets involves a great deal of risk, including the loss of all or a portion of your investment, as well as emotional distress. All risks, losses and costs associated with investing, including total loss of principal, are your responsibility. The views and opinions expressed in this article are those of the authors and do not necessarily reflect the official policy or position of FXStreet nor its advertisers. The author will not be held responsible for information that is found at the end of links posted on this page.

If not otherwise explicitly mentioned in the body of the article, at the time of writing, the author has no position in any stock mentioned in this article and no business relationship with any company mentioned. The author has not received compensation for writing this article, other than from FXStreet.

FXStreet and the author do not provide personalized recommendations. The author makes no representations as to the accuracy, completeness, or suitability of this information. FXStreet and the author will not be liable for any errors, omissions or any losses, injuries or damages arising from this information and its display or use. Errors and omissions excepted.

The author and FXStreet are not registered investment advisors and nothing in this article is intended to be investment advice.

Recommended content


Recommended content

Editors’ Picks

EUR/USD stays in positive territory above 1.0850 after US data

EUR/USD stays in positive territory above 1.0850 after US data

EUR/USD clings to modest daily gains above 1.0850 in the second half of the day on Friday. The improving risk mood makes it difficult for the US Dollar to hold its ground after PCE inflation data, helping the pair edge higher ahead of the weekend.

EUR/USD News

GBP/USD stabilizes above 1.2850 as risk mood improves

GBP/USD stabilizes above 1.2850 as risk mood improves

GBP/USD maintains recovery momentum and fluctuates above 1.2850 in the American session on Friday. The positive shift seen in risk mood doesn't allow the US Dollar to preserve its strength and supports the pair.

GBP/USD News

Gold rebounds above $2,380 as US yields stretch lower

Gold rebounds above $2,380 as US yields stretch lower

Following a quiet European session, Gold gathers bullish momentum and trades decisively higher on the day above $2,380. The benchmark 10-year US Treasury bond yield loses more than 1% on the day after US PCE inflation data, fuelling XAU/USD's upside.

Gold News

Avalanche price sets for a rally following retest of key support level

Avalanche price sets for a rally following retest of  key support level

Avalanche (AVAX) price bounced off the $26.34 support level to trade at $27.95 as of Friday. Growing on-chain development activity indicates a potential bullish move in the coming days.

Read more

The election, Trump's Dollar policy, and the future of the Yen

The election, Trump's Dollar policy, and the future of the Yen

After an assassination attempt on former President Donald Trump and drop out of President Biden, Kamala Harris has been endorsed as the Democratic candidate to compete against Trump in the upcoming November US presidential election.

Read more

Forex MAJORS

Cryptocurrencies

Signatures