|

NZD/USD Price Analysis: Continues losing streak amid firm US Dollar

  • NZD/USD falls further to 0.6140 as the Fed’s hawkish remarks improve the US Dollar’s appeal.
  • Sost US inflation reports have prompted Fed rate-cut prospects for September.
  • China’s weak data weighs on the New Zealand Dollar.

The NZD/USD pair extends its losing streak for the third trading day on Monday. The Kiwi asset declines to near 0.6140 as the US Dollar (USD) clings to gains amid a tug of war between Federal Reserve (Fed) and market speculation for how much interest rates will be reduced this year.

Fed policymakers have acknowledged that the progress in inflation declining to bank’s target of 2% has resumed after the release of the cooler consumer and producer inflation reports for May. However, they want to see price pressures declining for months before considering rate cuts. Therefore, they expect room for only one rate-cut this year.

However, soft inflation reports have boosted market expectations for two rate cuts this year. The CME FedWatch tool shows that the Fed will start reducing interest rates from the September meeting and will cut again in the November or December meeting.

Meanwhile, the New Zealand Dollar weakens after various Chinese economic indicators suggested uncertainty over the economic outlook. In May, the House Price Index deflated by 3.9%, and Industrial Production and YTD Fixed Asset Investment grew slower than expected by 5.6% and 4%, respectively. However, Retail Sales rose by 3.7%, beat expectations of 3% and the prior release of 2.3%. The New Zealand (NZ) economy is one of the leading trading partners of China, and the latter’s weak economic performance impacts the Kiwi dollar.

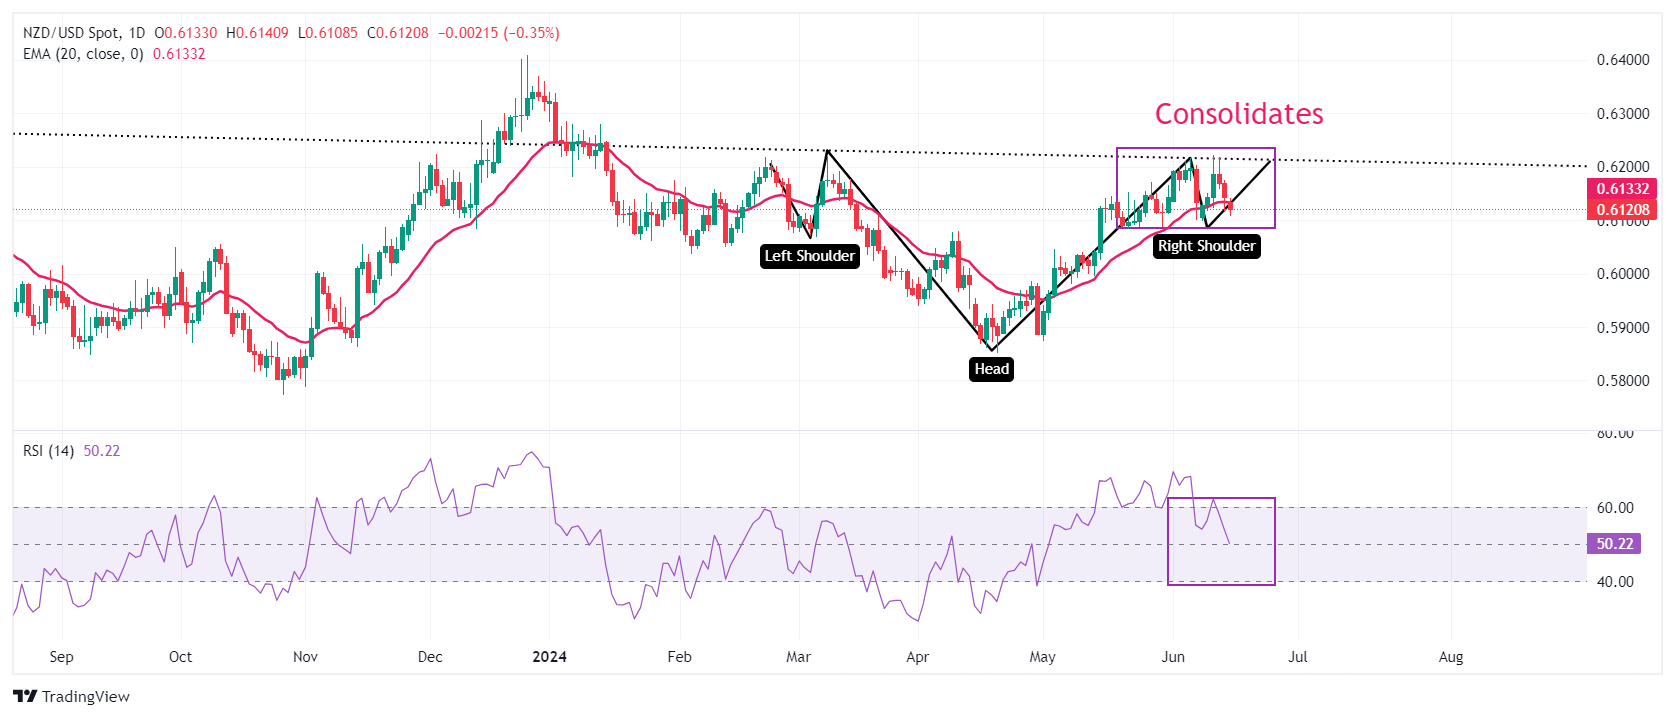
NZD/USD declines while attempting to deliver a breakout of the Inverted Head and Shoulder (H&S) chart pattern formed on a daily timeframe. The neckline of the above-mentioned chart pattern is marked near 0.6215. The asset has declined below the 20-day Exponential Moving Average (EMA) near 0.6130, which indicates an uncertain near-term outlook.

The 14-period Relative Strength Index (RSI) falls back into the 40.00-60.00 range, indicating that the upside momentum has faded.

Fresh downside would appear if the asset breaks below April 4 high around 0.6050 This would drag the asset towards the psychological support of 0.6000 and April 25 high at 0.5969.

On the contrary, a reversal move above June 12 high of 0.6222, which will expose the asset January 15 high near 0.6250, followed by January 12 high near 0.6280.

NZD/USD daily chart

NZD/USD

Overview
Today last price0.612
Today Daily Change-0.0022
Today Daily Change %-0.36
Today daily open0.6142
 
Trends
Daily SMA200.6142
Daily SMA500.6046
Daily SMA1000.607
Daily SMA2000.6061
 
Levels
Previous Daily High0.6176
Previous Daily Low0.6115
Previous Weekly High0.6222
Previous Weekly Low0.6099
Previous Monthly High0.6171
Previous Monthly Low0.5875
Daily Fibonacci 38.2%0.6138
Daily Fibonacci 61.8%0.6152
Daily Pivot Point S10.6113
Daily Pivot Point S20.6084
Daily Pivot Point S30.6052
Daily Pivot Point R10.6174
Daily Pivot Point R20.6205
Daily Pivot Point R30.6234

Author

Sagar Dua

Sagar Dua

FXStreet

Sagar Dua is associated with the financial markets from his college days. Along with pursuing post-graduation in Commerce in 2014, he started his markets training with chart analysis.

More from Sagar Dua
Share:

Editor's Picks

GBP/USD bounces off lows, back above 1.3200

After bottoming out near 1.3160, GBP/USD manages to regain a bit of shine and reclaim the 1.3200 mark and beyond at the end of the week. Stronger-than-expected UK Retail Sales data seem to be helping the British Pound limit its losses, while the chaotic UK political environment keeps the bulls at bay for now.

EUR/USD looks consolidative around 1.1460

EUR/USD stages a modest rebound after slipping to a three-month low below 1.1420 at the end of the week. That said, the pair now looks to consolidate humble gains just above 1.1460 despite growing uncertainty surrounding the next round of US-Iran negotiations, which keeps the US Dollar’s downside contained.

Gold slips back to six-day lows, targets $4,100

Gold retreats for the third consecutive day on Friday, eroding gains seen in the first half of the week and approaching the key $4,100 mark per troy ounce. Indeed, the precious metal continues to face headwinds from the Fed's hawkish stance and renewed uncertainty surrounding the next round of US-Iran negotiations.

Solana extends correction despite ETF inflows, RWA adoption

Solana (SOL) price edges below $70 extending its losses for the fourth straight day this week. The institutional demand for Solana is building, with steady inflows so far this week and Morgan Stanley’s amended S-1 filing for a Solana-focused Exchange-Traded Fund.

The Iran war didn't break the US economy, but what happens next?

Nearly four months after the start of the Iran war, the US economy remains remarkably resilient. While the conflict initially triggered a severe disruption to global energy markets and a sharp rise in Oil prices, recent diplomatic progress between Washington and Tehran has eased concerns about a prolonged supply shock.

Regime change: Inside Kevin Warsh's first move to make the Fed unreadable on purpose

The rate did not move. That was the least interesting thing about Kevin Warsh's first meeting in charge of the Fed. The FOMC held its benchmark at 3.50%-3.75% for the fourth straight meeting, exactly as priced, and then the new chair used his first press conference to dismantle the machinery the market has leaned on for a decade.