|

NZD/USD Price Analysis: Attempts Bullish Flag breakout

  • NZD/USD jumps to 0.6815 after downbeat US ISM Manufacturing PMI report.
  • Weak factory activity report dents the US Dollar’s appeal.
  • The RBNZ is less likely to return to the policy normalization process this year.

The NZD/USD pair advances to 0.6185 in Monday’s American session as the United States (US) Institute of Supply Management (ISM) has reported a weak Manufacturing PMI report for May. The agency reported that the Manufacturing PMI, which gauges the factory activity, surprisingly declines to 48.7 from the estimates of 49.8 and the former release of 49.2.

Apart from that, other sub-components such as New Orders and Prices Paid Indexes were also weaker than expectations, weighing on the US Dollar (USD). Weak factory data is expected to boost market speculation for the Federal Reserve (Fed) to begin reducing interest rates from the September meeting. The US Dollar Index (DXY) slumps to 104.25.

Meanwhile, the New Zealand Dollar remains firm as investors expect that the Reserve Bank of New Zealand (RBNZ) will not consider lowering interest rates this year. Also, there is a debate that the RBNZ could hike its Official Cash Rate further. Meanwhile, RBNZ Governor Adrian Orr has already commented that more rate hikes remain off the table as long as inflation expectations remain anchored.

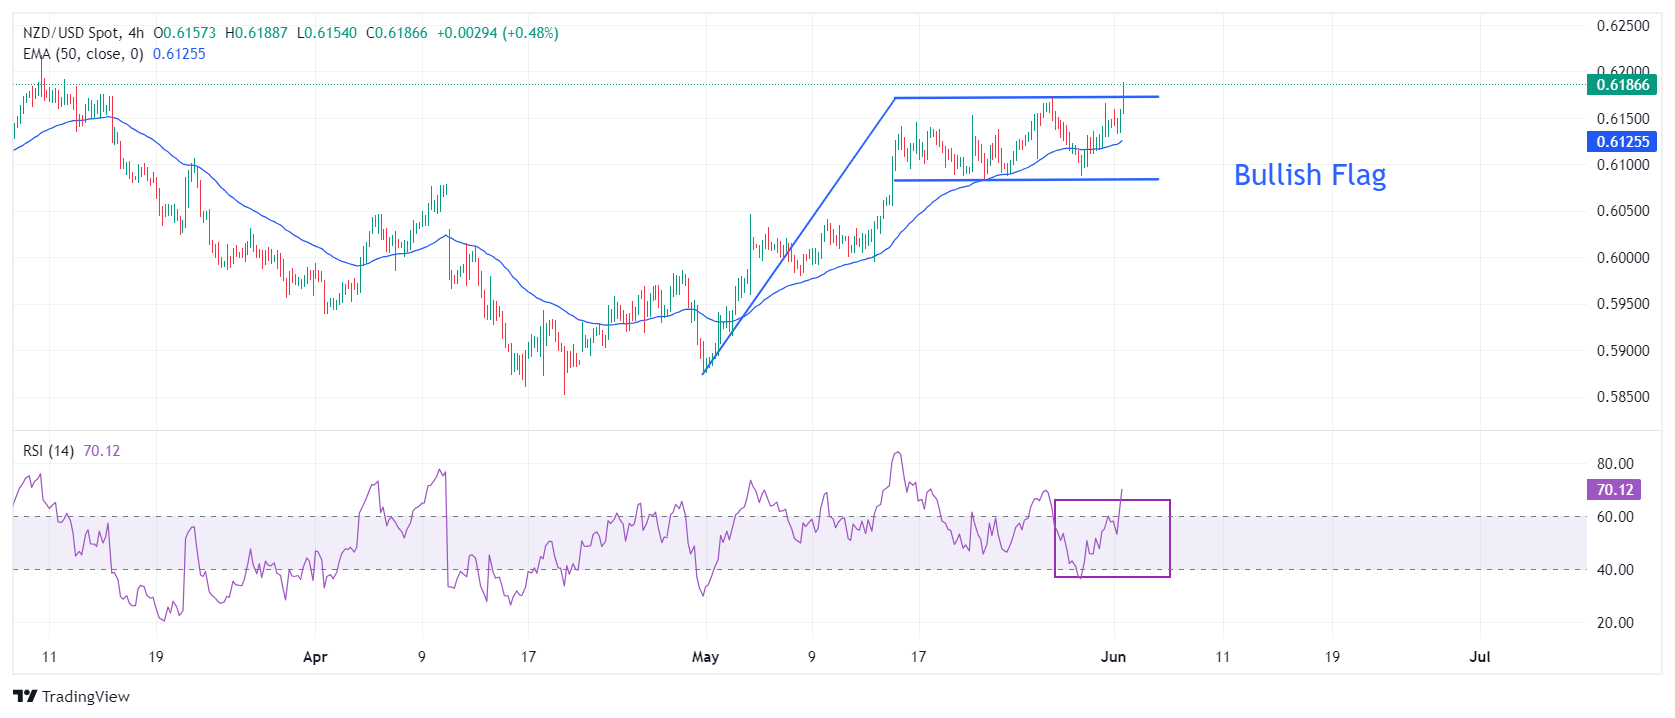
NZD/USD attempts to break the Bullish Flag chart formation in a four-hour timeframe, which exhibits an inventory adjustment process between institutional investors and retail participants. This pattern indicates a consolidation after a sharp upside move and it generally breaks towards the direction of the trend, which in this is upwards.

The 50-period Exponential Moving Average (EMA) near 0.6126 continues to provide support to the New Zealand Dollar bulls.

Meanwhile, the 14-period Relative Strength Index (RSI) has climbed above 60.00. A sustainable move above 60.00 will strengthen Kiwi bulls further.

An upside move above the round-level resistance of 0.6200 will drive the asset January 15 high near 0.6250, followed by January 12 high near 0.6280.

On the contrary, fresh downside would appear if the asset breaks below April 4 high around 0.6050 This would drag the asset towards the psychological support of 0.6000 and April 25 high at 0.5969.

NZD/USD daily chart

NZD/USD

Overview
Today last price0.6185
Today Daily Change0.0042
Today Daily Change %0.68
Today daily open0.6143
 
Trends
Daily SMA200.6084
Daily SMA500.6011
Daily SMA1000.6064
Daily SMA2000.6048
 
Levels
Previous Daily High0.6166
Previous Daily Low0.6111
Previous Weekly High0.6171
Previous Weekly Low0.6088
Previous Monthly High0.6171
Previous Monthly Low0.5875
Daily Fibonacci 38.2%0.6145
Daily Fibonacci 61.8%0.6132
Daily Pivot Point S10.6114
Daily Pivot Point S20.6086
Daily Pivot Point S30.606
Daily Pivot Point R10.6169
Daily Pivot Point R20.6195
Daily Pivot Point R30.6223

Author

Sagar Dua

Sagar Dua

FXStreet

Sagar Dua is associated with the financial markets from his college days. Along with pursuing post-graduation in Commerce in 2014, he started his markets training with chart analysis.

More from Sagar Dua
Share:

Markets move fast. We move first.

Orange Juice Newsletter brings you expert driven insights - not headlines. Every day on your inbox.

By subscribing you agree to our Terms and conditions.

Editor's Picks

EUR/USD struggles for direction amid USD gains

EUR/USD is trimming part of its earlier gains, coming under some mild downside pressure near 1.1730 as the US Dollar edges higher. Markets are still digesting the Fed’s latest rate decision, while also looking ahead to more commentary from Fed officials in the sessions ahead.

GBP/USD drops to daily lows near 1.3360

Disappointing UK data weighed on the Sterling towards the end of the week, triggering a pullback in GBP/USD to fresh daily lows near 1.3360. Looking ahead, the next key event across the Channel is the BoE meeting on December 18.

Gold losses momentum, challenges $4,300

Gold now gives away some gains and disputes the key $4,300 zone per troy ounce following earlier multi-week highs. The move is being driven by expectations that the Fed will deliver further rate cuts next year, with the yellow metal climbing despite a firmer Greenback and rising US Treasury yields across the board.

Litecoin Price Forecast: LTC struggles to extend gains, bullish bets at risk

Litecoin (LTC) price steadies above $80 at press time on Friday, following a reversal from the $87 resistance level on Wednesday. Derivatives data suggests a bullish positional buildup while the LTC futures Open Interest declines, flashing a long squeeze risk.

Big week ends with big doubts

The S&P 500 continued to push higher yesterday as the US 2-year yield wavered around the 3.50% mark following a Federal Reserve (Fed) rate cut earlier this week that was ultimately perceived as not that hawkish after all. The cut is especially boosting the non-tech pockets of the market.

Aave Price Forecast: AAVE primed for breakout as bullish signals strengthen

Aave (AAVE) price is trading above $204 at the time of writing on Friday and approaching the upper boundary of its descending parallel channel; a breakout from this structure would favor the bulls.