- NZD/JPY fades bounce off six-week low after mixed NZ data.
- New Zealand’s Q3 Westpac Consumer Survey improved, trade deficit widened in August.
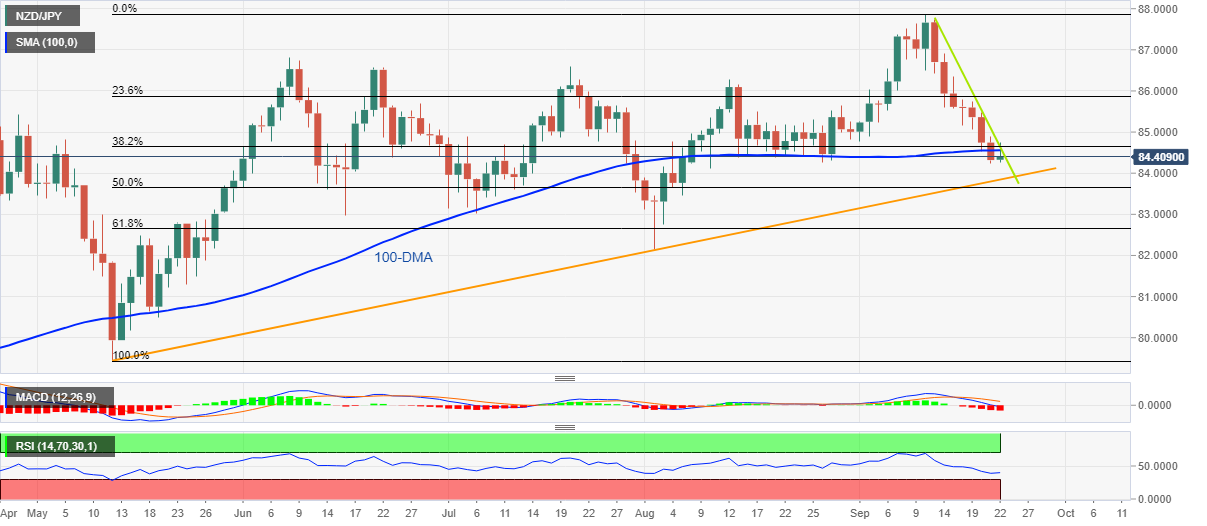
- Clear break of 100-DMA, weekly resistance line direct sellers towards four-month-old support.
- BOJ is likely to buck the trend of hawkish central bank announcements.
NZD/JPY retreats to 84.40 after a slew of New Zealand data failed to impress the pair buyers during Thursday’s Asian session. In doing so, the cross-currency pair defends the previous day’s downside break of the 100-DMA while also respecting the one-week-old descending resistance line.
New Zealand’s trade deficit widened to $12.28B during August versus $11.97B prior. Further details suggest that the Imports grew to $7.93B from $7.76B previous readings while the Exports dropped to $5.48B compared to $6.35B previous announcements. Earlier in the day, the nation’s Westpac Consumer Survey data for the third quarter (Q3) probed the NZD/USD bears while matching 87.6 forecasts versus 78.7 prior. “Consumer confidence in New Zealand improved in the third quarter but the mood in the country remains grim,” said Reuters following the data release.
On the other hand, the majority of the global central banks have been hawkish in lifting their benchmark rates so far but the Bank of Japan (BOJ) isn’t expected to do so, which in turn keeps the room for a surprise favor and weigh on the prices.
Also read: BOJ Preview: One day, it will surprise us all, but not today
Given the bearish MACD signals and the downbeat RSI (14), not oversold, joining the aforementioned catalysts, the NZD/JPY is on the way to testing an upward sloping support line from May, close to 83.85 by the press time.
Following that, the 50% and 61.8% Fibonacci retracement levels of May-September advances, respectively near 83.65 and 82.60, could lure the pair bears.
Meanwhile, recovery moves will need to cross the 100-DMA and the immediate resistance line, around 84.55 and 84.65 in that order, to convince NZD/JPY buyers.
In a case where the quote remains firmer past 84.65, a run-up towards June’s peak surrounding 86.80 can’t be ruled out.
NZD/JPY: Daily chart
Trend: Further weakness expected
Information on these pages contains forward-looking statements that involve risks and uncertainties. Markets and instruments profiled on this page are for informational purposes only and should not in any way come across as a recommendation to buy or sell in these assets. You should do your own thorough research before making any investment decisions. FXStreet does not in any way guarantee that this information is free from mistakes, errors, or material misstatements. It also does not guarantee that this information is of a timely nature. Investing in Open Markets involves a great deal of risk, including the loss of all or a portion of your investment, as well as emotional distress. All risks, losses and costs associated with investing, including total loss of principal, are your responsibility. The views and opinions expressed in this article are those of the authors and do not necessarily reflect the official policy or position of FXStreet nor its advertisers. The author will not be held responsible for information that is found at the end of links posted on this page.
If not otherwise explicitly mentioned in the body of the article, at the time of writing, the author has no position in any stock mentioned in this article and no business relationship with any company mentioned. The author has not received compensation for writing this article, other than from FXStreet.
FXStreet and the author do not provide personalized recommendations. The author makes no representations as to the accuracy, completeness, or suitability of this information. FXStreet and the author will not be liable for any errors, omissions or any losses, injuries or damages arising from this information and its display or use. Errors and omissions excepted.
The author and FXStreet are not registered investment advisors and nothing in this article is intended to be investment advice.
Recommended content
Editors’ Picks
EUR/USD edges lower toward 1.0700 post-US PCE
EUR/USD stays under modest bearish pressure but manages to hold above 1.0700 in the American session on Friday. The US Dollar (USD) gathers strength against its rivals after the stronger-than-forecast PCE inflation data, not allowing the pair to gain traction.
GBP/USD retreats to 1.2500 on renewed USD strength
GBP/USD lost its traction and turned negative on the day near 1.2500. Following the stronger-than-expected PCE inflation readings from the US, the USD stays resilient and makes it difficult for the pair to gather recovery momentum.
Gold struggles to hold above $2,350 following US inflation
Gold turned south and declined toward $2,340, erasing a large portion of its daily gains, as the USD benefited from PCE inflation data. The benchmark 10-year US yield, however, stays in negative territory and helps XAU/USD limit its losses.
Bitcoin Weekly Forecast: BTC’s next breakout could propel it to $80,000 Premium
Bitcoin’s recent price consolidation could be nearing its end as technical indicators and on-chain metrics suggest a potential upward breakout. However, this move would not be straightforward and could punish impatient investors.
Week ahead – Hawkish risk as Fed and NFP on tap, Eurozone data eyed too
Fed meets on Wednesday as US inflation stays elevated. Will Friday’s jobs report bring relief or more angst for the markets? Eurozone flash GDP and CPI numbers in focus for the Euro.