Natural Gas playing a close call to close above $3.0 ahead of the weekend
- Natural Gas recovers a touch on Friday after its technical correction on Thursday.
- European Natural Gas is looking for direction with
- The US Dollar Index trades higher, driven by a weaker Euro and Japanese Yen.

Natural Gas price (XNG/USD) recovers slightly on Friday after briefly dipping lower and briefly breaking below the $3.0 figure on Thursday. The risk for more downside comes with the political turmoil in Europe, particularly in France, that is causing distress in the European sovereign bond markets, hurting the growth potential for the bloc. On the other hand, a string of court rulings in favor of several big industrial companies against Russian Gas exporter Gazprom and supply issues in Australia are pushing up European prices close to a six-month high.
Meanwhile, the US Dollar Index (DXY), which tracks the Greenback’s value against six major currencies, is trading in the green with help from its two main contributors accounting for 70% of the DXY: the Euro (EUR) and Japanese Yen (JPY). With a rather slim economic calendar ahead, only the University of Michigan Sentiment could bring some US Dollar weakness. However, the recent decline in the Consumer Price Index numbers (CPI) and Producer Price Index (PPI) numbers makes it more difficult for consumer sentiment to take a significant hit.
Natural Gas is trading at $3.02 per MMBtu at the time of writing.
Natural Gas news and market movers: Gas traders unsure what to do next
- Russian President Vladimir Putin has opened the door again for peace negotiations with a list of requirements before taking a seat at the table.
- Supply issues in Australia persist ahead of the weekend, with the Wheatstone offshore plant from Chevron still fully shut down. Repairs will take longer than expected, Reuters reports.
- European Gas prices saw a similar pattern, where the rally got snapped this week, while traders look to Egypt as the country keeps hoarding Liquified Natural Gas (LNG) in order to meet summer heat season and energy demand.
- The EIA (Energy Information Administration) reported on Thursday that the Natural Gas Storage Change was a build of 74 billion cubic feet of natural gas against 98 billion cubic feet last week.
Natural Gas Technical Analysis: Europe stutters
Europe’s performance will be key in terms of demand in the near term. Should Europe’s economy start to underperform due to political and sovereign tensions, the risk for a more sluggish outlook could hurt demand. On the other hand, a pickup in demand is expected should Europe’s economy pick up pace.The pivotal level near $3.07 (the high from March 6, 2023) remains key as prices on Wednesday closed above it by just a few cents. Looking up, the red descending trendline at $3.12 would likely slam down any attempts to jump higher. Further up, the fresh year-to-date high at $3.16 is the level to beat.
On the downside, the 200-day Simple Moving Average (SMA) acts as the first support near $2.53. Should that support area fail to hold, the next target could be the pivotal level near $2.14, with interim support by the 55-day SMA near $2.34. Further down, the biggest support comes at $2.11 with the 100-day SMA.
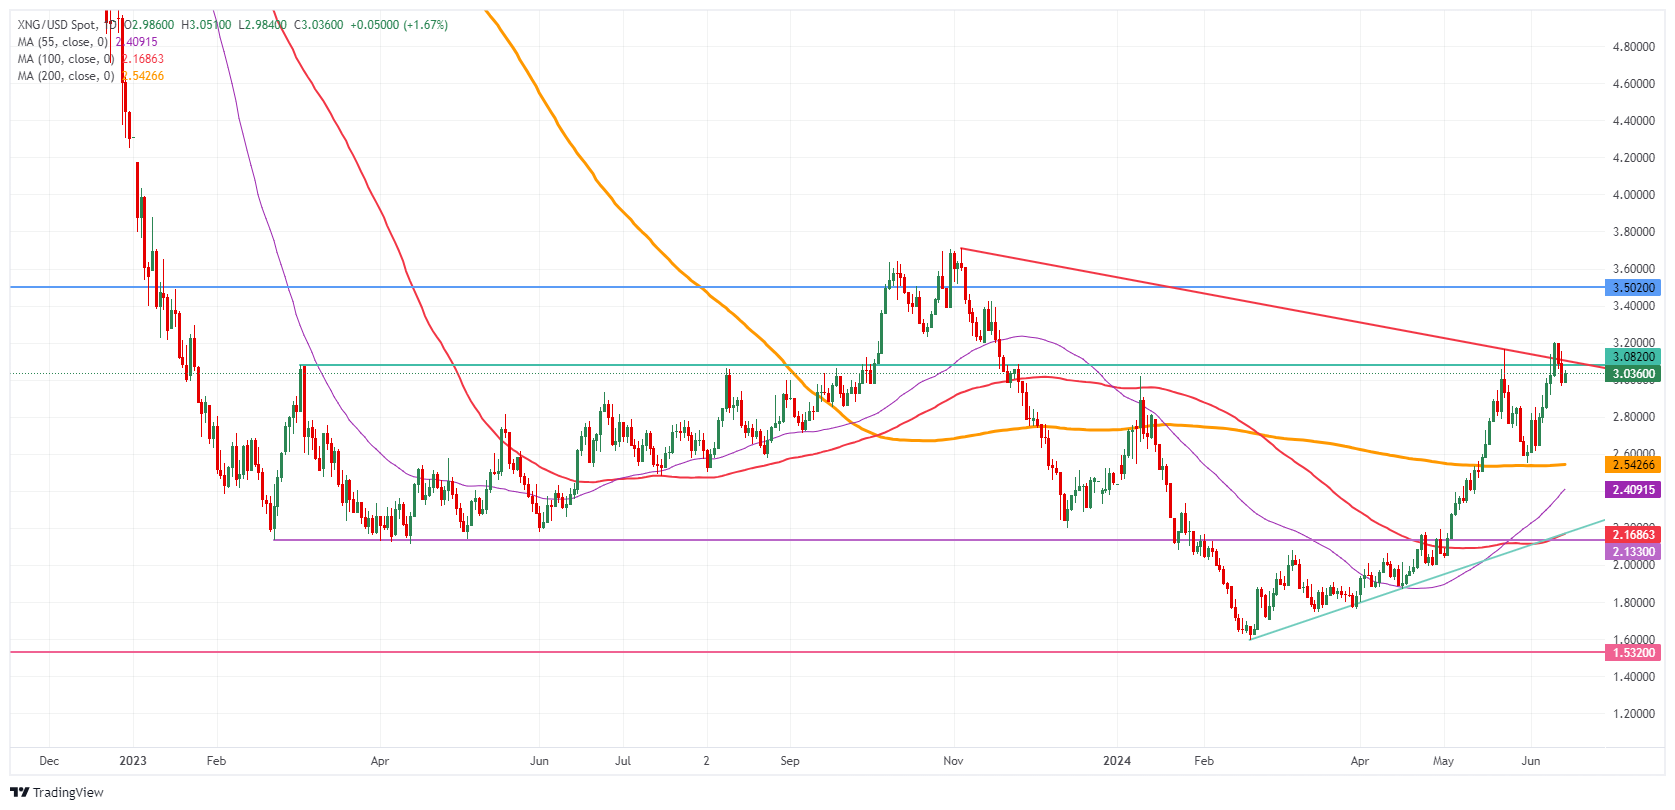
Natural Gas: Daily Chart
Natural Gas FAQs
Supply and demand dynamics are a key factor influencing Natural Gas prices, and are themselves influenced by global economic growth, industrial activity, population growth, production levels, and inventories. The weather impacts Natural Gas prices because more Gas is used during cold winters and hot summers for heating and cooling. Competition from other energy sources impacts prices as consumers may switch to cheaper sources. Geopolitical events are factors as exemplified by the war in Ukraine. Government policies relating to extraction, transportation, and environmental issues also impact prices.
The main economic release influencing Natural Gas prices is the weekly inventory bulletin from the Energy Information Administration (EIA), a US government agency that produces US gas market data. The EIA Gas bulletin usually comes out on Thursday at 14:30 GMT, a day after the EIA publishes its weekly Oil bulletin. Economic data from large consumers of Natural Gas can impact supply and demand, the largest of which include China, Germany and Japan. Natural Gas is primarily priced and traded in US Dollars, thus economic releases impacting the US Dollar are also factors.
The US Dollar is the world’s reserve currency and most commodities, including Natural Gas are priced and traded on international markets in US Dollars. As such, the value of the US Dollar is a factor in the price of Natural Gas, because if the Dollar strengthens it means less Dollars are required to buy the same volume of Gas (the price falls), and vice versa if USD strengthens.
Author

Filip Lagaart
FXStreet
Filip Lagaart is a former sales/trader with over 15 years of financial markets expertise under its belt.


