Mexican Peso rebounds following release of macroeconomic data

Most recent article: Mexican Peso uptrend extends bolstered by inflation data
- The Mexican Peso recovers after the release of more inflationary data from Mexico.
- The data makes it less likely the Bank of Mexico will cut interest rates, which supports the currency.
- On the charts, USD/MXN closes in on a key support level at 17.87.
The Mexican Peso (MXN) trades higher in its key pairs on Tuesday after the release of more inflationary data from Mexico.
More broadly, the Peso drifts higher as carry flows continue to favor the Mexican Peso against its counterparts due to the attractiveness to foreign investors of the relatively high interest rates on offer in Mexico (11.00%).
Given that the just-released data shows inflation edging higher, the likelihood of interest rates falling any time soon is further diminished, adding even more support to MXN.
At the time of writing, one US Dollar (USD) buys 17.94 Mexican Pesos, EUR/MXN trades at 19.43, and GBP/MXN at 23.00.
Mexican Peso recovers as Banxico less likely to cut interest rates
The Mexican Peso recovers following the release of key macroeconomic data for Mexico on Tuesday.
The Headline Inflation rate in Mexico came out at 0.38% on a month-on-month basis in June, beating the 0.24% expected by economists and higher than the negative 0.19% of the previous month, according to data from INEGI.
Core Inflation for June, which excludes volatile food and energy components, was 0.22%, falling below the 0.24% estimated by economists but above the 0.17% in May.
The 12-month Inflation rate in June, meanwhile, came out at 4.98%, which was higher than the 4.84% expected by economists and the 4.69% previously.
Mexican Consumer Confidence rose to 48.1 in June compared to 46.7 in May.
The data makes it less likely the Bank of Mexico (Banxico) will be in a hurry to cut interest rates anytime soon. It comes after the Deputy Governor of the Banxico, Jonathan Heath, said he was adopting a data-dependent stance similar to that of Federal Reserve Chairman Jerome Powell in the US.
Technical Analysis: USD/MXN slides lower towards the line in the sand
USD/MXN continues steadily declining as a short-term downtrend unfolds towards the key June 24 line-in-the-sand low at 17.87.
USD/MXN Daily Chart
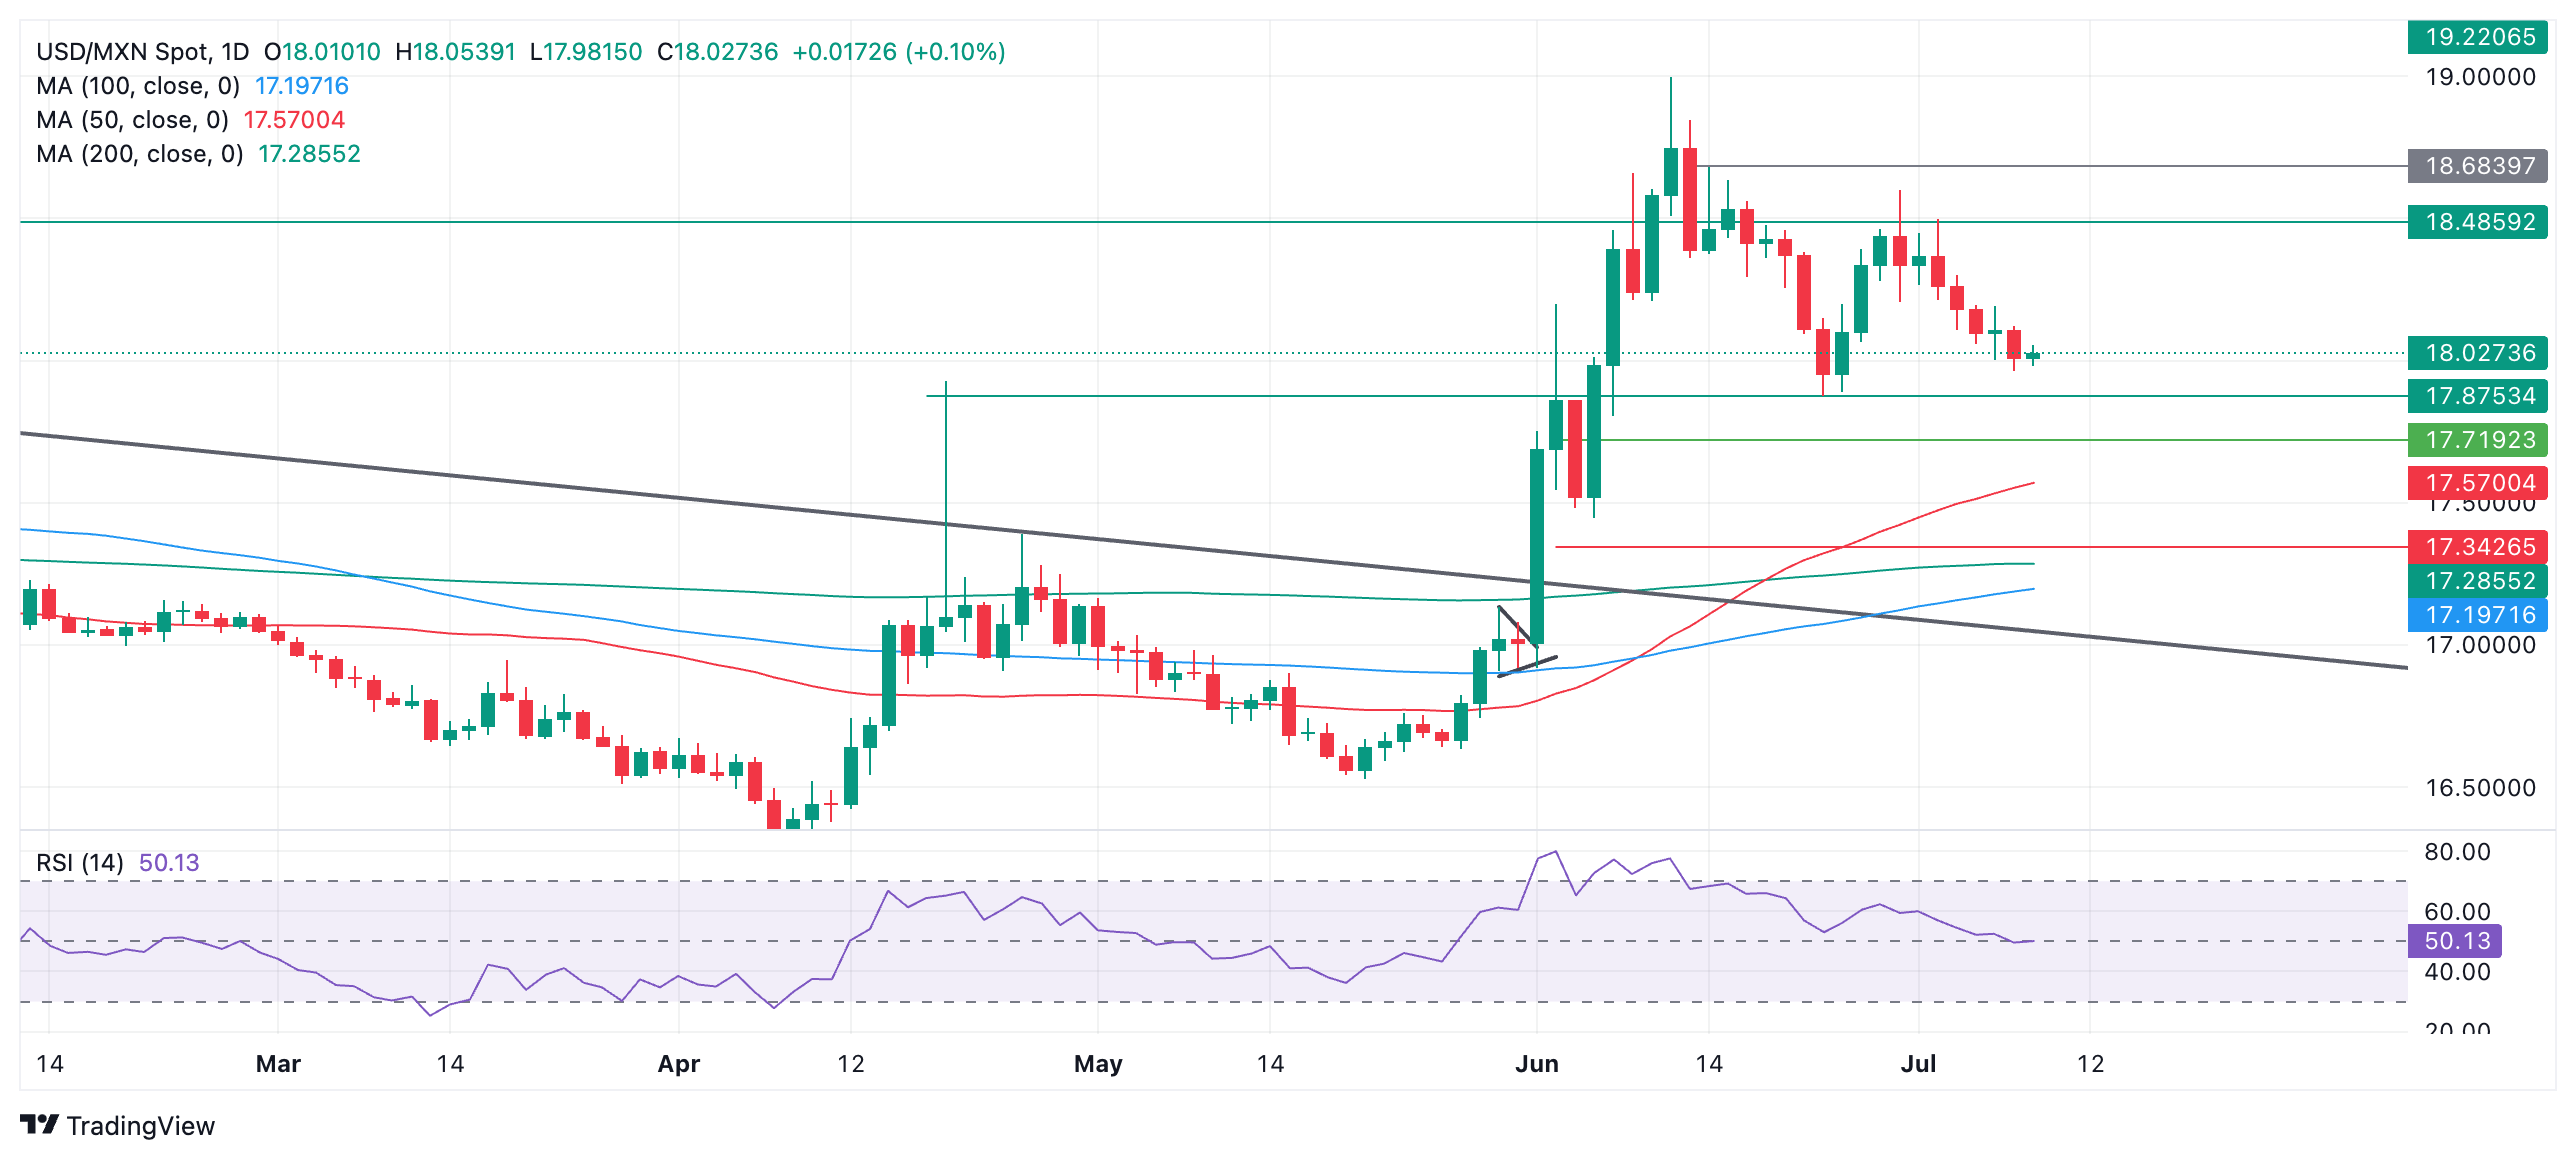
The pair is likely to encounter support at the 17.87 level and could bounce. A decisive break below, however, would reconfirm the down-trending bias, with the next target lying at 17.50 (50-day Simple Moving Average).
It is possible the pair could be about to enter a sideways trend, with the floor at the aforesaid June 24 low and a ceiling at the 18.50 level, although this would require a reversal and rebound higher, and remains a speculative guess.
As things stand, the short-term trend is bearish, and the “the trend is your friend” adage suggests it will extend.
The direction of the medium and long-term trends, meanwhile, remains in doubt.
Economic Indicator
12-Month Inflation
The 12-month inflation index released by the Bank of Mexico is a measure of price movements by the comparison between the retail prices of a representative shopping basket of goods and services. The purchase power of Mexican Peso is dragged down by inflation. The inflation index is a key indicator since it is used by the central bank to set interest rates. Generally speaking, a high reading is seen as positive (or bullish) for the Mexican Peso, while a low reading is seen as negative (or Bearish).
Read more.Last release: Tue Jul 09, 2024 12:00
Frequency: Monthly
Actual: 4.98%
Consensus: 4.84%
Previous: 4.69%
Source: National Institute of Statistics and Geography of Mexico
Author

Joaquin Monfort
FXStreet
Joaquin Monfort is a financial writer and analyst with over 10 years experience writing about financial markets and alt data. He holds a degree in Anthropology from London University and a Diploma in Technical analysis.