Japanese Yen looks to be fading out this week without any interventions
- The Japanese Yen started Friday with a fresh multi-decade low print.
- Some quick profit taking is happening ahead of the US session and before the weekend.
- The US Dollar Index hovers around 106.00 again ahead of PCE inflation release.

The Japanese Yen (JPY) sees traders taunting the Japanese government yet again, with another new historic low printed in the Yen’s performance. This Friday 161.27 was briefly hit before falling back to below 161.00. The move comes with Japanese Finance Minister Shun’ichi Suzuki repeated the same message from Thursday that the Japanese cabinet is “watching the FX moves with a high sense of urgency”, which now has lost its impact and sees markets defying the Ministry in order to take action.
Meanwhile, the US Dollar Index (DXY) – which gauges the value of the US Dollar against a basket of six foreign currencies – is of course in positive territory on the back of this action. Even if US data on Thursday did not allow the US Dollar to outperform, with Durable Goods flatlining and Pending Home Sales shrinking again for a second month in a row. The Personal Consumption Expenditures numbers falling in line, and in their disinflationary trajectory and are not creating any big waves.
Daily digest market movers: Nothing done
- At 02:30 GMT, Japanese Finance Minister Shun’ichi Suzuki commented he is watching FX moves with a high sense of urgency. Though this time the impact resulted in a pickup in devaluation for the Japanese Yen. Markets expected to see action this Friday, not more words and same messages.
- At 12:30 GMT, the Personal Consumption Expenditures (PCE) for May got released:
- Headline PCE eased from 0.3% to 0.0%.
- Core PCE faded a touch from 0.2% to 0.1%.
- At 13:45 GMT, Chicago Purchase Managers Index jumped higher, to 47.4, coming from 35.4.
- At 14:00 GMT the University of Michigan will release June’s final reading:
- Sentiment Index rose from 65.6 to 68.2.
- Inflation expectations moves away from 3.1% to 3.0%.
- Equities have chosen to go out with a bang, and are printing green numbers across the globe.
- The CME Fedwatch Tool is broadly backing a rate cut in September despite recent comments from Federal Reserve (Fed) officials. The odds now stand at 57.9% for a 25-basis-point cut. A rate pause stands at a 35.9% chance, while a 50-basis-point rate cut has a slim 6.2% possibility.
- The Overnight indexed Swap curve for Japan shows a 57.9% chance of a rate hike on July 31, and a smaller 19.8% chance for a hike on September 20.
- The US 10-year benchmark rate trades around the middle of this week’s range near 4.27%.
- The benchmark 10-year Japan Treasury Note (JGB) trades around 1.05%, and is easing a touch for this week.
USD/JPY Technical Analysis: Intervention risk moved to next week
The USD/JPY has just printed a fresh multi-decade high this Friday. The catalyst for the move was the same as the one that triggered a bit of a recovery on Thursday: the words from Japanese Finance Minister Shun’ichi Suzuki. It becomes clear that markets have bought one time into these comments, and now want to see action, which is pushing the Japanese government into a corner and interventions are really looking inevitable.
Although the Relative Strength Index (RSI) is overbought in the daily chart, a correction could still take a few more days. Should PCE data come out further disinflationary, that would not be enough to drive USD/JPY down to 151.91. Instead, look at the 55-day Simple Moving Average (SMA) at 156.53 and the 100-day SMA at 153.81 for traders to quickly build a pivot on and try to test highs again, testing the Japanese deep pockets again.
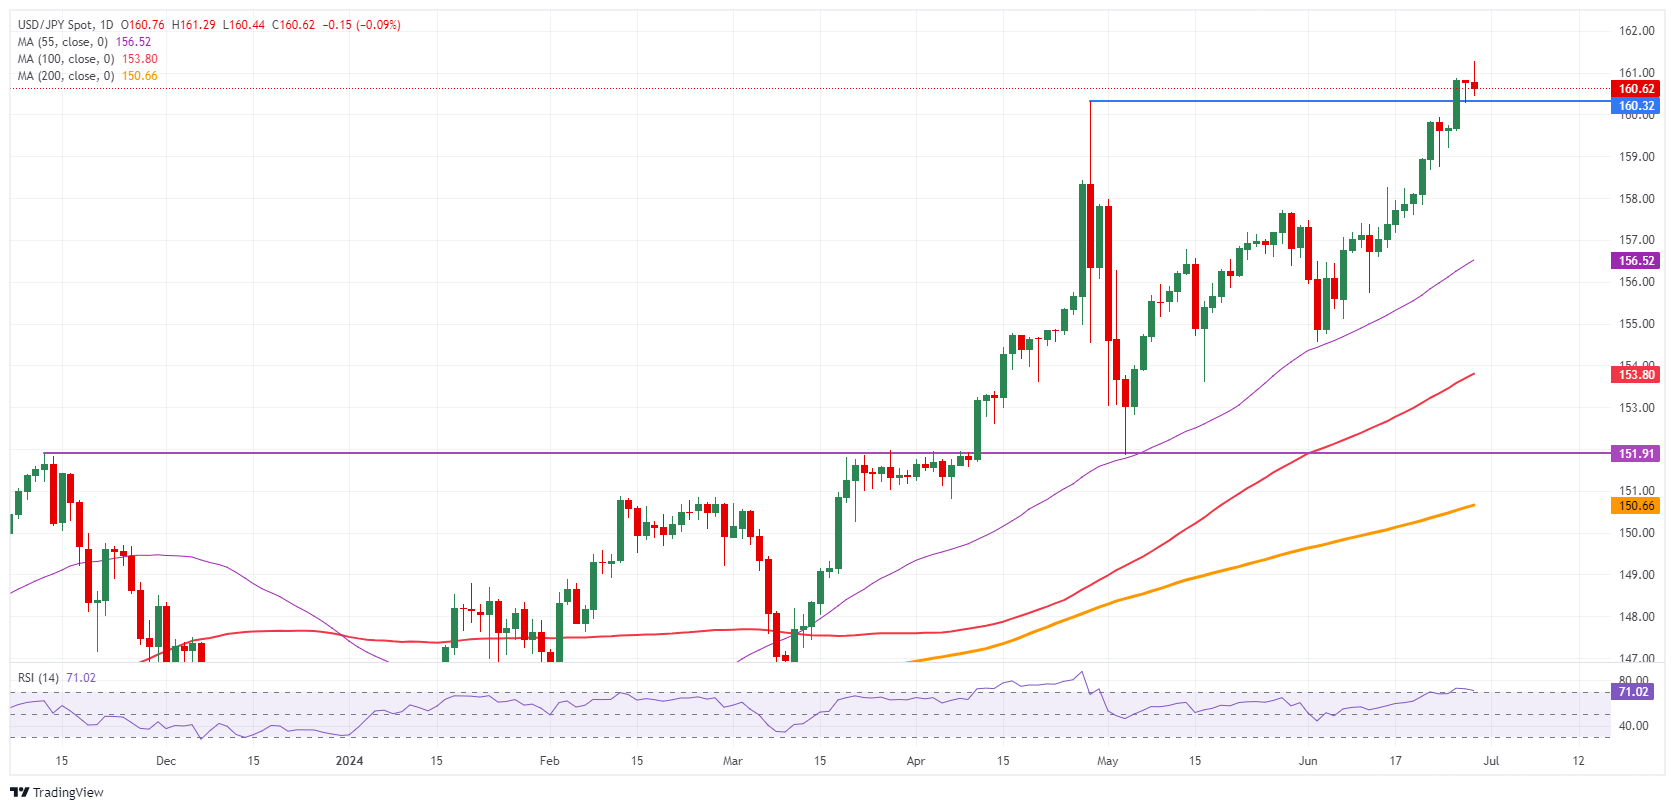
USD/JPY Daily Chart
Japanese Yen PRICE Last 7 days
The table below shows the percentage change of Japanese Yen (JPY) against listed major currencies last 7 days. Japanese Yen was the weakest against the Australian Dollar.
| USD | EUR | GBP | JPY | CAD | AUD | NZD | CHF | |
|---|---|---|---|---|---|---|---|---|
| USD | 0.00% | 0.09% | 1.03% | 0.09% | -0.15% | 0.54% | 0.93% | |
| EUR | -0.01% | 0.07% | 1.03% | 0.09% | -0.13% | 0.54% | 0.91% | |
| GBP | -0.09% | -0.07% | 0.93% | 0.00% | -0.22% | 0.45% | 0.85% | |
| JPY | -1.03% | -1.03% | -0.93% | -0.93% | -1.16% | -0.49% | -0.07% | |
| CAD | -0.09% | -0.09% | 0.00% | 0.93% | -0.25% | 0.44% | 0.85% | |
| AUD | 0.15% | 0.13% | 0.22% | 1.16% | 0.25% | 0.66% | 1.08% | |
| NZD | -0.54% | -0.54% | -0.45% | 0.49% | -0.44% | -0.66% | 0.40% | |
| CHF | -0.93% | -0.91% | -0.85% | 0.07% | -0.85% | -1.08% | -0.40% |
The heat map shows percentage changes of major currencies against each other. The base currency is picked from the left column, while the quote currency is picked from the top row. For example, if you pick the Japanese Yen from the left column and move along the horizontal line to the US Dollar, the percentage change displayed in the box will represent JPY (base)/USD (quote).
Author

Filip Lagaart
FXStreet
Filip Lagaart is a former sales/trader with over 15 years of financial markets expertise under its belt.


