IBM stock shrinks on paltry revenue growth
- IBM stock sinks nearly 7% on Q3 earnings miss.
- Revenue in third quarter missed Wall Street consensus by $110 million.
- Morgan Stanley lowers price target on IBM shares.
- Software was the only segment that grew from a year ago.

International Business Machines (IBM) flunked its latest test late Wednesday when the venerable tech company missed expectations for revenue in its third quarter. Shares plunged 6.7% midway through Thursday’s session, falling under $218 per share.
IBM’s pullback helped to send the Dow Jones Industrial Average (DJIA) back by half a percentage point by lunchtime, while the NASDAQ and S&P 500 both advanced moderately.
IBM stock earnings news
IBM reported $2.30 in adjusted earnings per share (EPS) on revenue of $14.97 billion. The profit was $0.07 ahead of Wall Street consensus, but revenue missed consensus by $110 million. Sales rose annually at 1.5%, below the rate of inflation.
The low level of revenue growth was frowned upon by the market, and management didn’t seem to think that it would change soon.
"Heading into the final quarter of 2024, we expect fourth-quarter constant currency revenue growth to be consistent with the third quarter, with continued strength in software," said IBM CEO Arvind Krishna.
Software was the only major business segment to see growth, expanding nearly 10% YoY to $6.5 billion. The infrastructure, financing and consulting segments also saw sales drop from a year ago.
Morgan Stanley lowered its price target on IBM from $217 to $208.
"3Q revenue of $15B was 1% below Morgan Stanley estimates, driven by a 1% miss in Consulting and a 6% miss in Infrastructure, partially offset by a 1% beat in Software," said a Morgan Stanley equity team led by analyst Erik Woodring.
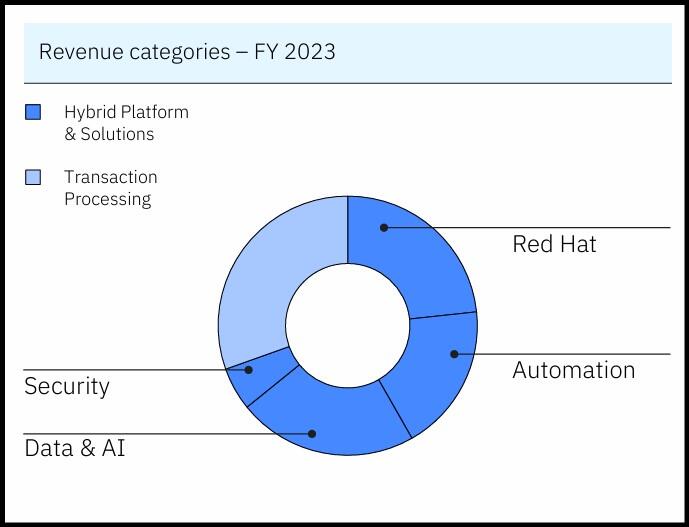
IBM Q3 2024 presentation (IBM)
IBM stock forecast
IBM stock sank close to the 50-day Simple Moving Average (SMA) on Thursday. A break there near $215 would likely send IBM stock down to the 100-day SMA near $197.
IBM stock has already gained more than 32% this year, more than twice the 13.3% advance of the Dow Jones index, so a pullback is unsurprising. The $200 psychological level seems like a conceivable level for support. It served as resistance in March of this year, and then it was used as support in early September.
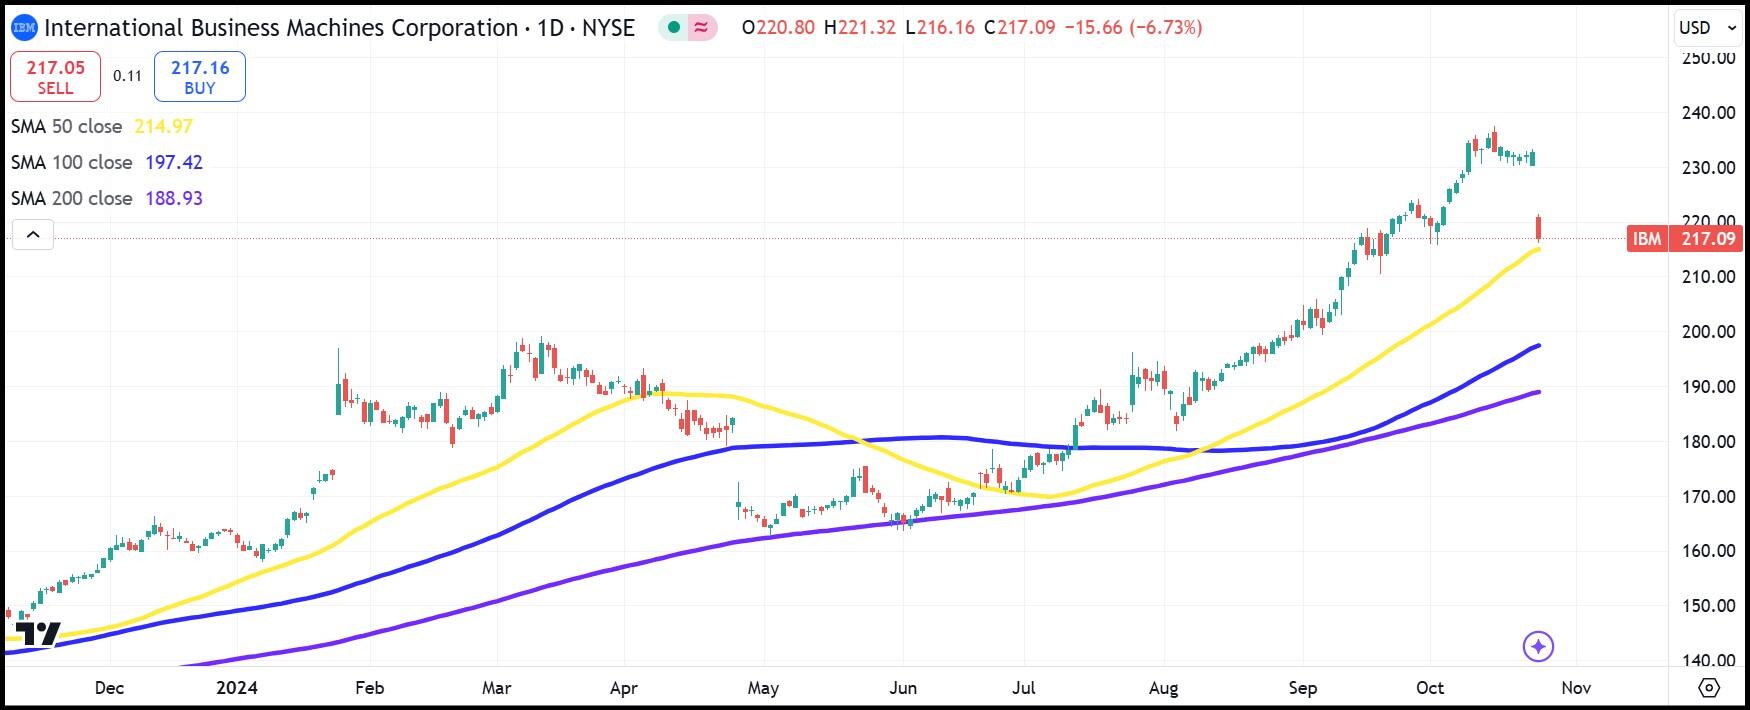
IBM daily stock chart
Premium
You have reached your limit of 3 free articles for this month.
Start your subscription and get access to all our original articles.
Author

Clay Webster
FXStreet
Clay Webster grew up in the US outside Buffalo, New York and Lancaster, Pennsylvania. He began investing after college following the 2008 financial crisis.


