Dow Jones Industrial Average eases back for fourth straight day
- The Dow Jones backslid another 0.9% at the low point on Thursday.
- Lopsided earnings reports have key equities tilted into the low side.
- The Dow is headed for its first losing week since August.

The Dow Jones Industrial Average (DJIA) trimmed further into the low end on Thursday, declining nearly 400 points at the bottom as uneven earnings figures dragged key stocks even lower. The major equity index has moderated to a more reasonable -150 points on the day, facing a 0.4% contraction from Thursday’s opening bids.
US Purchasing Managers Index (PMI) figures came in broadly higher than expected, helping to bolster overall equities despite sharp declines in key Dow-listed stocks. US Manufacturing PMI activity figures rose to 47.8 in October, beating the expected 47.5 and climbing even further from August’s 47.3. Meanwhile, the Services PMI component bounced to 55.3, climbing from the previous month’s 55.2 and beating the expected decline to 55.0.
Dow Jones news
Despite the overall upbeat print in key US activity figures, the Dow Jones is getting dragged into the red by losses in key weighted players. Roughly two-thirds of the index is testing into the red on Thursday, but most losses are contained within key players in the tech space as the chipmaker rally continues to wobble.
IBM (IBM) fumbled the ball, declining over 6.5% and slipping below $28 per share after missing revenue forecasts in the third quarter. Honeywell (HON) also shed weight, falling 5% and easing under $210 per share after revenue, which grew over the period, failed to meet Wall Street expectations, prompting the company to lower year-end guidance.
Dow Jones price forecast
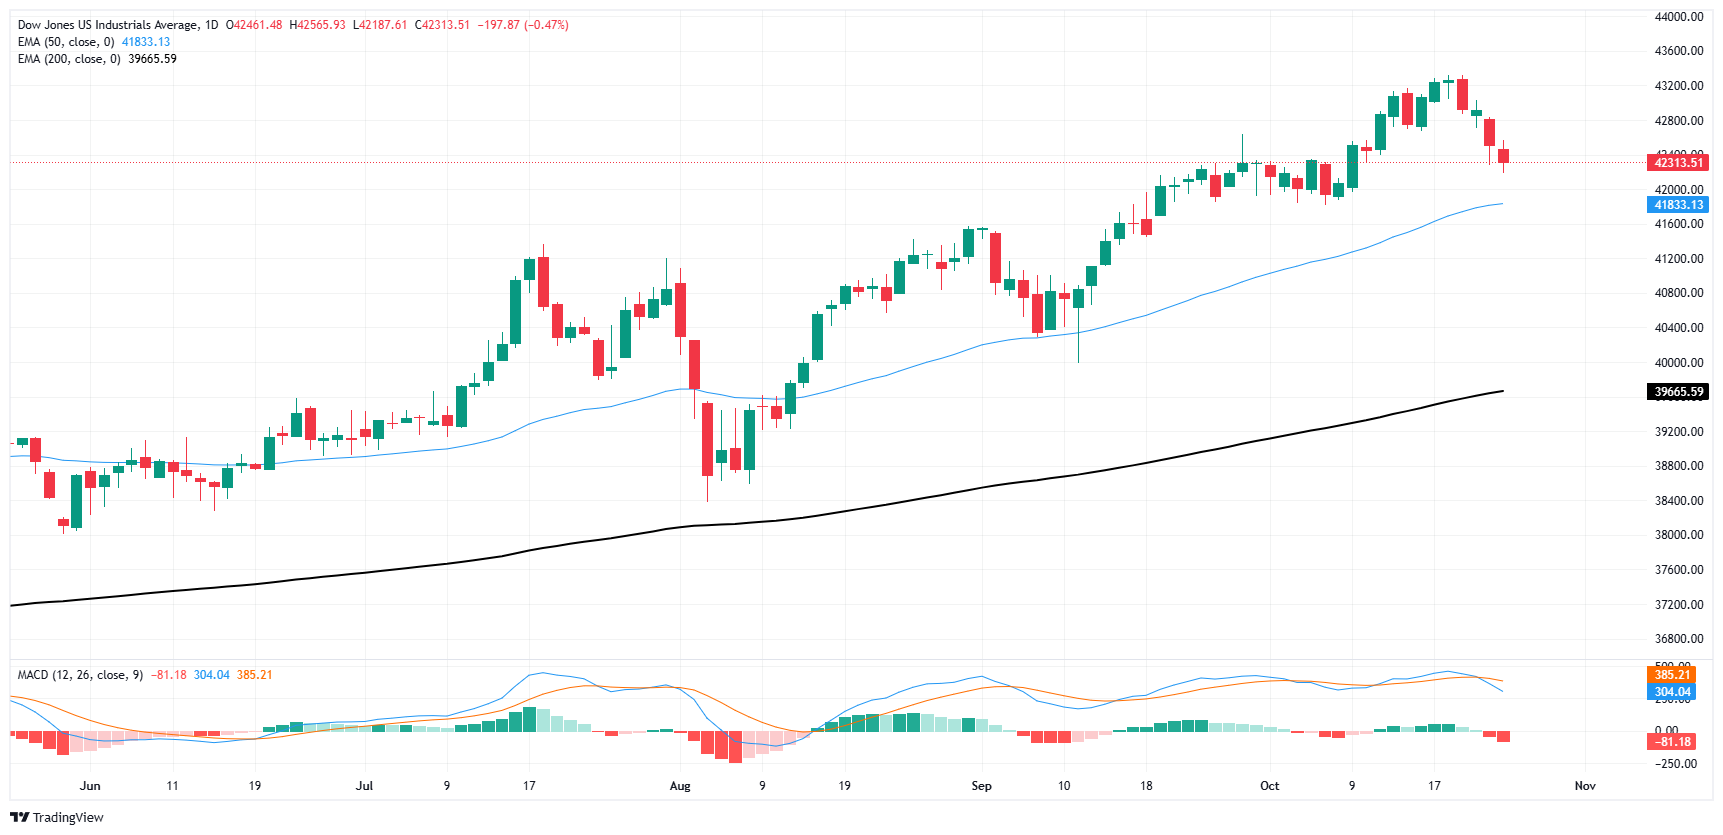
The Dow Jones Industrial Average (DJIA) daily chart reflects a bearish pullback after reaching a peak near 43,600. The index has dropped to 42,331, displaying a series of bearish candles as it approaches the 50-day EMA, currently at 41,833.
The 50-day EMA has provided support in the past, and it will be critical to monitor if this level holds once again. If it does, a potential bounce could see the price testing recent highs around 43,600. On the other hand, if the 50-day EMA is breached, a more significant correction could be in play, with the next support target around the 200-day EMA at 39,665.
The MACD indicator is signaling increasing bearish momentum. The MACD line has crossed below the signal line, and the histogram is deepening in negative territory. This confirms the weakening bullish sentiment and could suggest further downside in the short term. Traders should be cautious of additional bearish price action, especially if the DJIA fails to hold the 50-day EMA. A break below could accelerate selling pressure, with a deeper retracement toward the 200-day EMA in focus.
Dow Jones daily chart
Dow Jones FAQs
The Dow Jones Industrial Average, one of the oldest stock market indices in the world, is compiled of the 30 most traded stocks in the US. The index is price-weighted rather than weighted by capitalization. It is calculated by summing the prices of the constituent stocks and dividing them by a factor, currently 0.152. The index was founded by Charles Dow, who also founded the Wall Street Journal. In later years it has been criticized for not being broadly representative enough because it only tracks 30 conglomerates, unlike broader indices such as the S&P 500.
Many different factors drive the Dow Jones Industrial Average (DJIA). The aggregate performance of the component companies revealed in quarterly company earnings reports is the main one. US and global macroeconomic data also contributes as it impacts on investor sentiment. The level of interest rates, set by the Federal Reserve (Fed), also influences the DJIA as it affects the cost of credit, on which many corporations are heavily reliant. Therefore, inflation can be a major driver as well as other metrics which impact the Fed decisions.
Dow Theory is a method for identifying the primary trend of the stock market developed by Charles Dow. A key step is to compare the direction of the Dow Jones Industrial Average (DJIA) and the Dow Jones Transportation Average (DJTA) and only follow trends where both are moving in the same direction. Volume is a confirmatory criteria. The theory uses elements of peak and trough analysis. Dow’s theory posits three trend phases: accumulation, when smart money starts buying or selling; public participation, when the wider public joins in; and distribution, when the smart money exits.
There are a number of ways to trade the DJIA. One is to use ETFs which allow investors to trade the DJIA as a single security, rather than having to buy shares in all 30 constituent companies. A leading example is the SPDR Dow Jones Industrial Average ETF (DIA). DJIA futures contracts enable traders to speculate on the future value of the index and Options provide the right, but not the obligation, to buy or sell the index at a predetermined price in the future. Mutual funds enable investors to buy a share of a diversified portfolio of DJIA stocks thus providing exposure to the overall index.
Author

Joshua Gibson
FXStreet
Joshua joins the FXStreet team as an Economics and Finance double major from Vancouver Island University with twelve years' experience as an independent trader focusing on technical analysis.