Gold trades in a range following mixed signals from US economy
- Gold continues to trade in a range established in spring as traders respond to mixed macroeconomic signals.
- Whilst the data points to a fall in inflation, Fed officials are more cautious.
- XAU/USD has probably formed a bearish Head-and-Shoulders pattern on the daily chart.

Gold (XAU/USD) trades marginally higher, exchanging hands in the $2,330s on Friday. Asian bourses lacked directionality overnight and mixed signals from the US regarding the future path of interest rates – a key driver for Gold – are doing little to help establish directionality for the precious metal.
Gold stuck in a range during period of uncertainty
Gold yo-yos in familiar territory as conflicting signals leave traders guessing. This is especially true about the future course of interest rates in the US.
Whilst the country’s economic data points to a disinflationary trend, which would be expected to lead to lower interest rates, the central bankers tasked with making the cuts are acting more cautious. Lower interest rates would be a positive catalyst for Gold as they would reduce the opportunity cost of holding the non-yielding asset. However, it is unclear when and by how much rates will fall.
The release of disinflationary US Producer Price Index (PPI) data on Thursday, the market’s gauge of “factory gate” price growth, provided more evidence of a reduction in inflationary pressures, suggesting the Federal Reserve (Fed) could move to cut interest rates in the near-term.
Yet the data came after the Fed on Wednesday revised down – from three to one – the number of interest-rate cuts it expects to make in 2024 In addition, Fed Chairman Jerome Powell dismissed the importance of the cooler-than-expected Consumer Price Index (CPI) data in May, released only a few hours earlier, saying it was only one data point, and endorsing a data-dependent approach going forward.
Gold price itself rose over half a percent to a peak of $2,342 after the disinflationary CPI release, before backtracking on the Fed’s more cautious stance.
The CPI data balanced out robust US Nonfarm Payrolls (NFP) figures on Friday, which reflected a buoyant labor market and rising wages in the US. These factors would be expected to put upside pressure on inflation, keeping interest rates high.
Gold has also been left reeling after the People’s Bank of China (PBoC) revealed they had stopped buying the precious metal between the end of April and May. It was the first time in 18-months the PBoC had not added to their Gold reserves and suggested a price cap might have been reached. At the same, analysts at Citibank point to continued strong demand from consumers in China, which they say will push Gold higher.
Thus the overall picture remains mixed for Gold traders as they await the next main data release from the US on Friday, the preliminary Michigan Consumer Sentiment Index for June.
Technical Analysis: Gold forms Head-and-Shoulders top
Gold continues to form what looks like a bearish Head-and-Shoulders (H&S) price pattern. H&Ss tend to occur at market tops and signal a change of trend.
XAU/USD Daily Chart
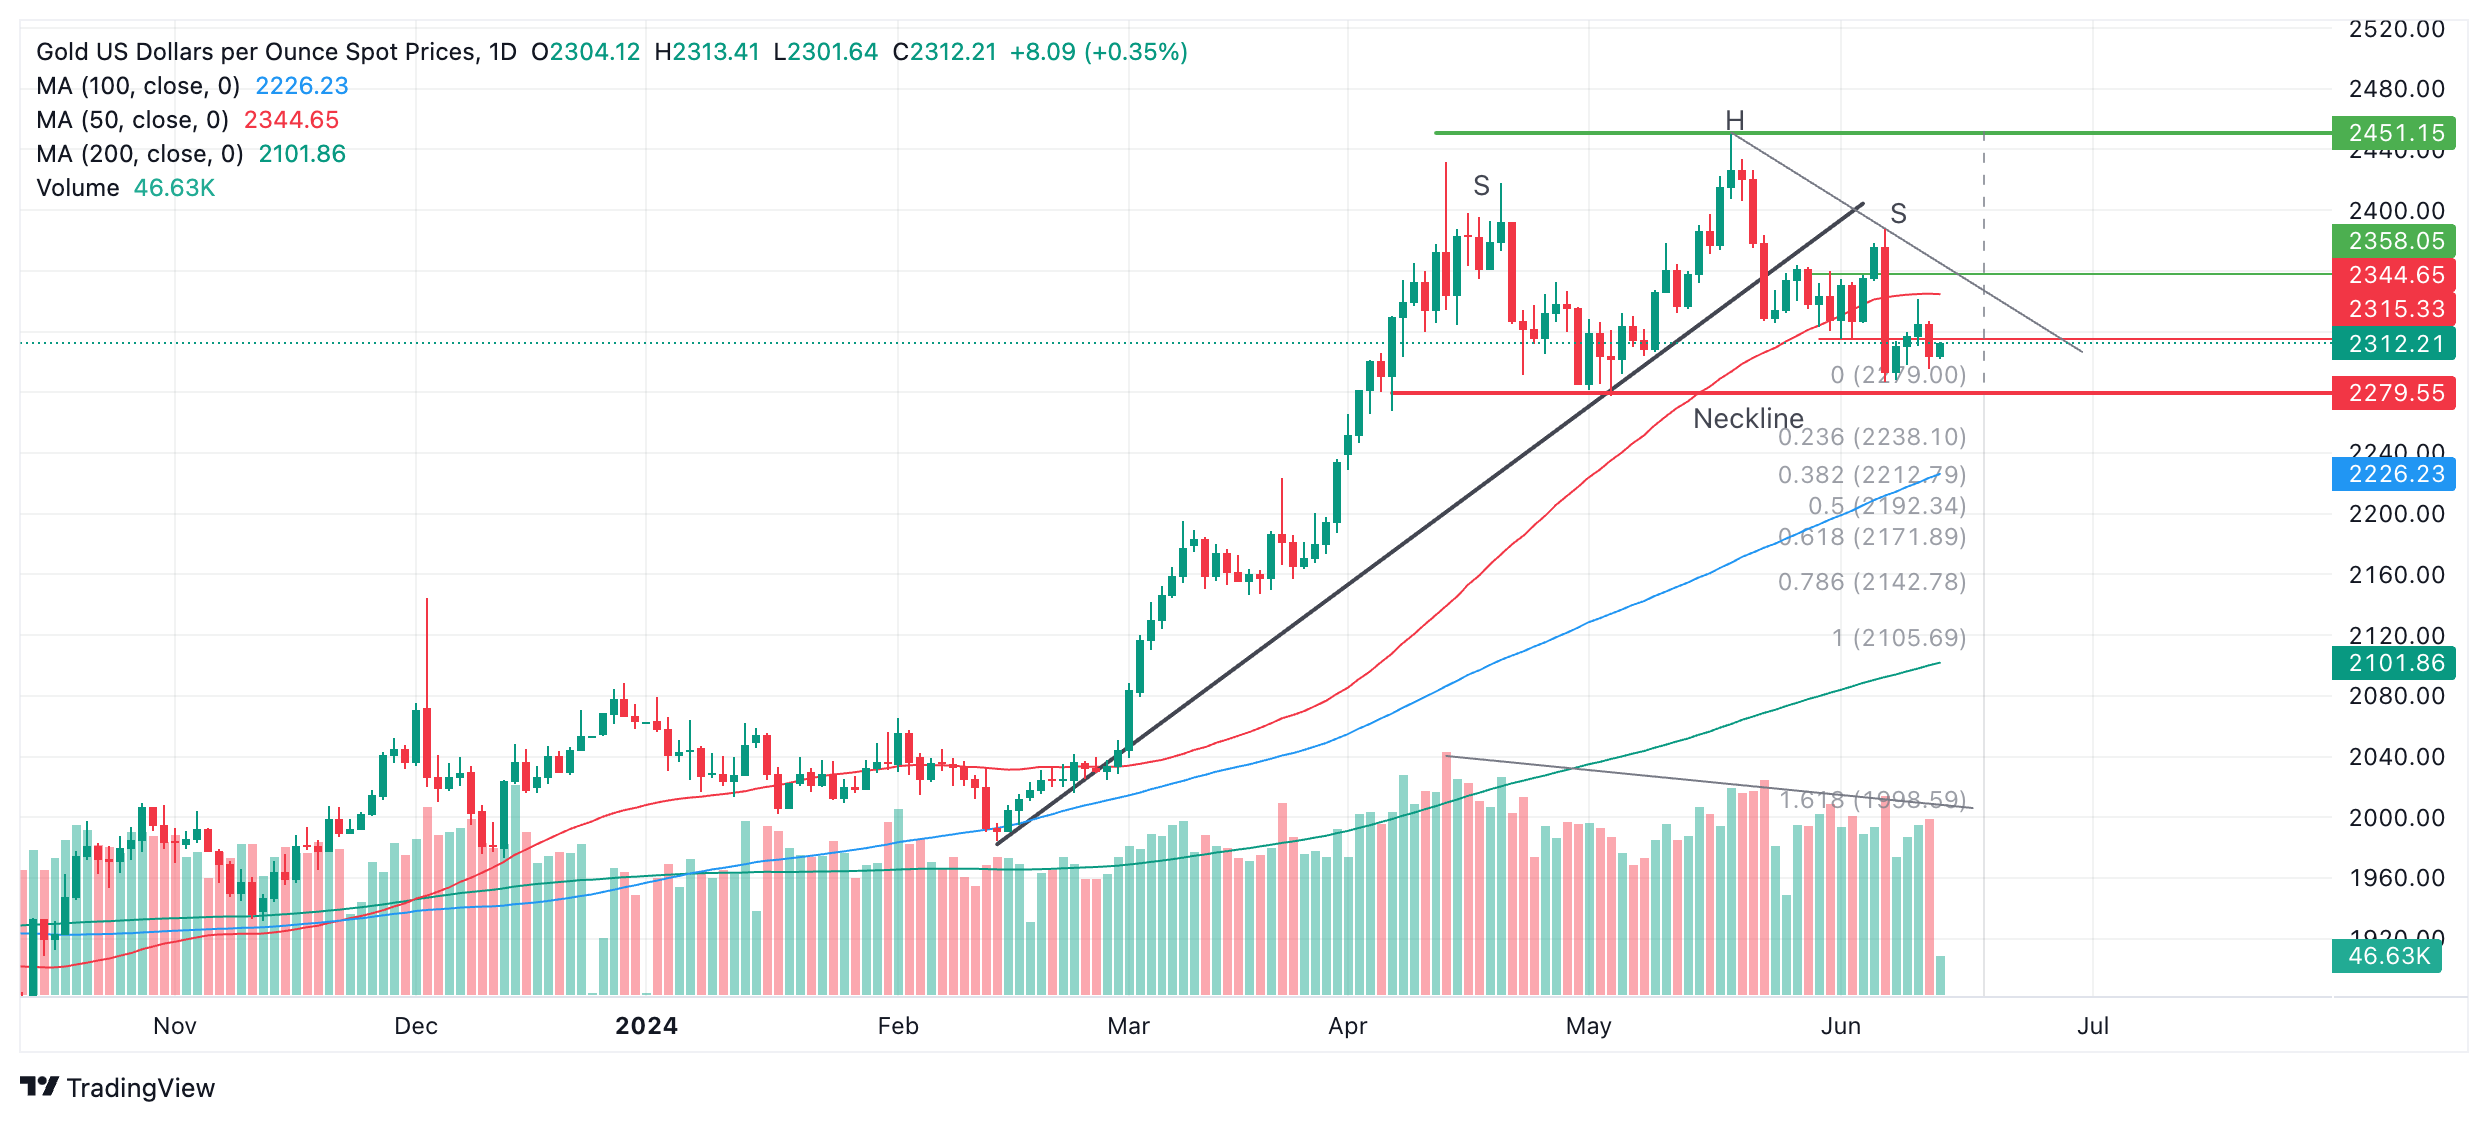
The H&S on Gold has completed a left and right shoulder (labeled “S”) and a “head” (labeled “H”). The so-called “neckline” of the pattern appears to be at the $2,279 support level (red line).
Declining trade volume during its development corroborates the pattern.
A decisive break below the neckline would validate the H&S pattern and activate downside targets. The first, more conservative, target would be $2,171, calculated by taking the 0.618 Fibonacci ratio of the height of the pattern and extrapolating it lower from the neckline. The second target would be at $2,106, the full height of the pattern extrapolated lower.
A break above $2,345, however, would bring the H&S into doubt and could signal a continuation higher, to an initial target at the $2,450 peak.
Gold FAQs
Gold has played a key role in human’s history as it has been widely used as a store of value and medium of exchange. Currently, apart from its shine and usage for jewelry, the precious metal is widely seen as a safe-haven asset, meaning that it is considered a good investment during turbulent times. Gold is also widely seen as a hedge against inflation and against depreciating currencies as it doesn’t rely on any specific issuer or government.
Central banks are the biggest Gold holders. In their aim to support their currencies in turbulent times, central banks tend to diversify their reserves and buy Gold to improve the perceived strength of the economy and the currency. High Gold reserves can be a source of trust for a country’s solvency. Central banks added 1,136 tonnes of Gold worth around $70 billion to their reserves in 2022, according to data from the World Gold Council. This is the highest yearly purchase since records began. Central banks from emerging economies such as China, India and Turkey are quickly increasing their Gold reserves.
Gold has an inverse correlation with the US Dollar and US Treasuries, which are both major reserve and safe-haven assets. When the Dollar depreciates, Gold tends to rise, enabling investors and central banks to diversify their assets in turbulent times. Gold is also inversely correlated with risk assets. A rally in the stock market tends to weaken Gold price, while sell-offs in riskier markets tend to favor the precious metal.
The price can move due to a wide range of factors. Geopolitical instability or fears of a deep recession can quickly make Gold price escalate due to its safe-haven status. As a yield-less asset, Gold tends to rise with lower interest rates, while higher cost of money usually weighs down on the yellow metal. Still, most moves depend on how the US Dollar (USD) behaves as the asset is priced in dollars (XAU/USD). A strong Dollar tends to keep the price of Gold controlled, whereas a weaker Dollar is likely to push Gold prices up.
Author

Joaquin Monfort
FXStreet
Joaquin Monfort is a financial writer and analyst with over 10 years experience writing about financial markets and alt data. He holds a degree in Anthropology from London University and a Diploma in Technical analysis.


