Gold trades lower on outlook for US interest rates
- Gold follows the general commodity pack lower on Monday.
- Traders weigh US economic data with Fedspeak to model future interest rates in the US, a key driver for Gold.
- XAU/USD continues forming a bearish Head-and-Shoulders pattern on the daily chart.

Gold (XAU/USD) trades marginally lower in the $2,310s on Monday, as possibility that US interest rates might remain high for the foreseeable future weighs on the precious metal.
At their policy meeting last Wednesday, US Federal Reserve (Fed) officials expressed reluctance to signal future cuts to interest rates due to persistent inflation. This, in turn, keeps the opportunity cost of owning non-yielding Gold high, and strengthens the US Dollar, in which Gold is priced.
Gold trades marginally lower amid weak data, a cautious Fed
Gold trades down about half a percent on Monday, exchanging hands in a familiar range as traders weigh up the evidence regarding the future trajectory of US interest rates, a key factor in evaluating the Gold price.
The release of US Producer Price Index (PPI) data on Thursday, the market’s gauge of “factory gate” price growth, provided evidence of a reduction in inflationary pressures, suggesting a higher probability the Federal Reserve (Fed) could move to cut interest rates in the near-term – a positive for Gold.
Yet the Fed itself revised down – from three to one – the number of interest-rate cuts it foresaw making in 2024, at its meeting on Wednesday. Additionally, Fed Chairman Jerome Powell dismissed the importance of the cooler-than-expected Consumer Price Index (CPI) data, released only a few hours earlier, saying it was only one data point, and endorsing a data-dependent approach going forward.
Gold price rose over half a percent to a peak of $2,342 after the disinflationary CPI release, before backtracking on the Fed’s more cautious stance.
On Friday, the Michigan Consumer Sentiment Index declined for the third straight month in a row to 65.6 in June, from 69.1 in May and well below forecasts of 72, preliminary estimates showed. Year-ahead inflation expectations remained unchanged at 3.3%, but the five-year one edged up to 3.1% from 3.0% in May, according to data from the University of Michigan. The overall takeaway from the data seemed to be that it reflected a slowdown in the economy with marginally bullish connotations for Gold.
Gold met pressure following the release of Gold reserves data from The People’s Bank of China (PBoC) last week. The data revealed that the PBoC stopped buying the precious metal between the end of April and May. It was the first time in 18 months the PBoC had not increased its Gold reserves. The inference was that Gold might be overpriced in their view. At the same, analysts at Citibank point to continued strong demand from consumers in China, which, they say, could contribute to a rise in Gold during 2024.
Technical Analysis: Gold forms Head-and-Shoulders top
Gold is still forming what looks like a bearish Head-and-Shoulders (H&S) price pattern. These patterns tend to occur at market tops and signal a change of trend.
XAU/USD Daily Chart
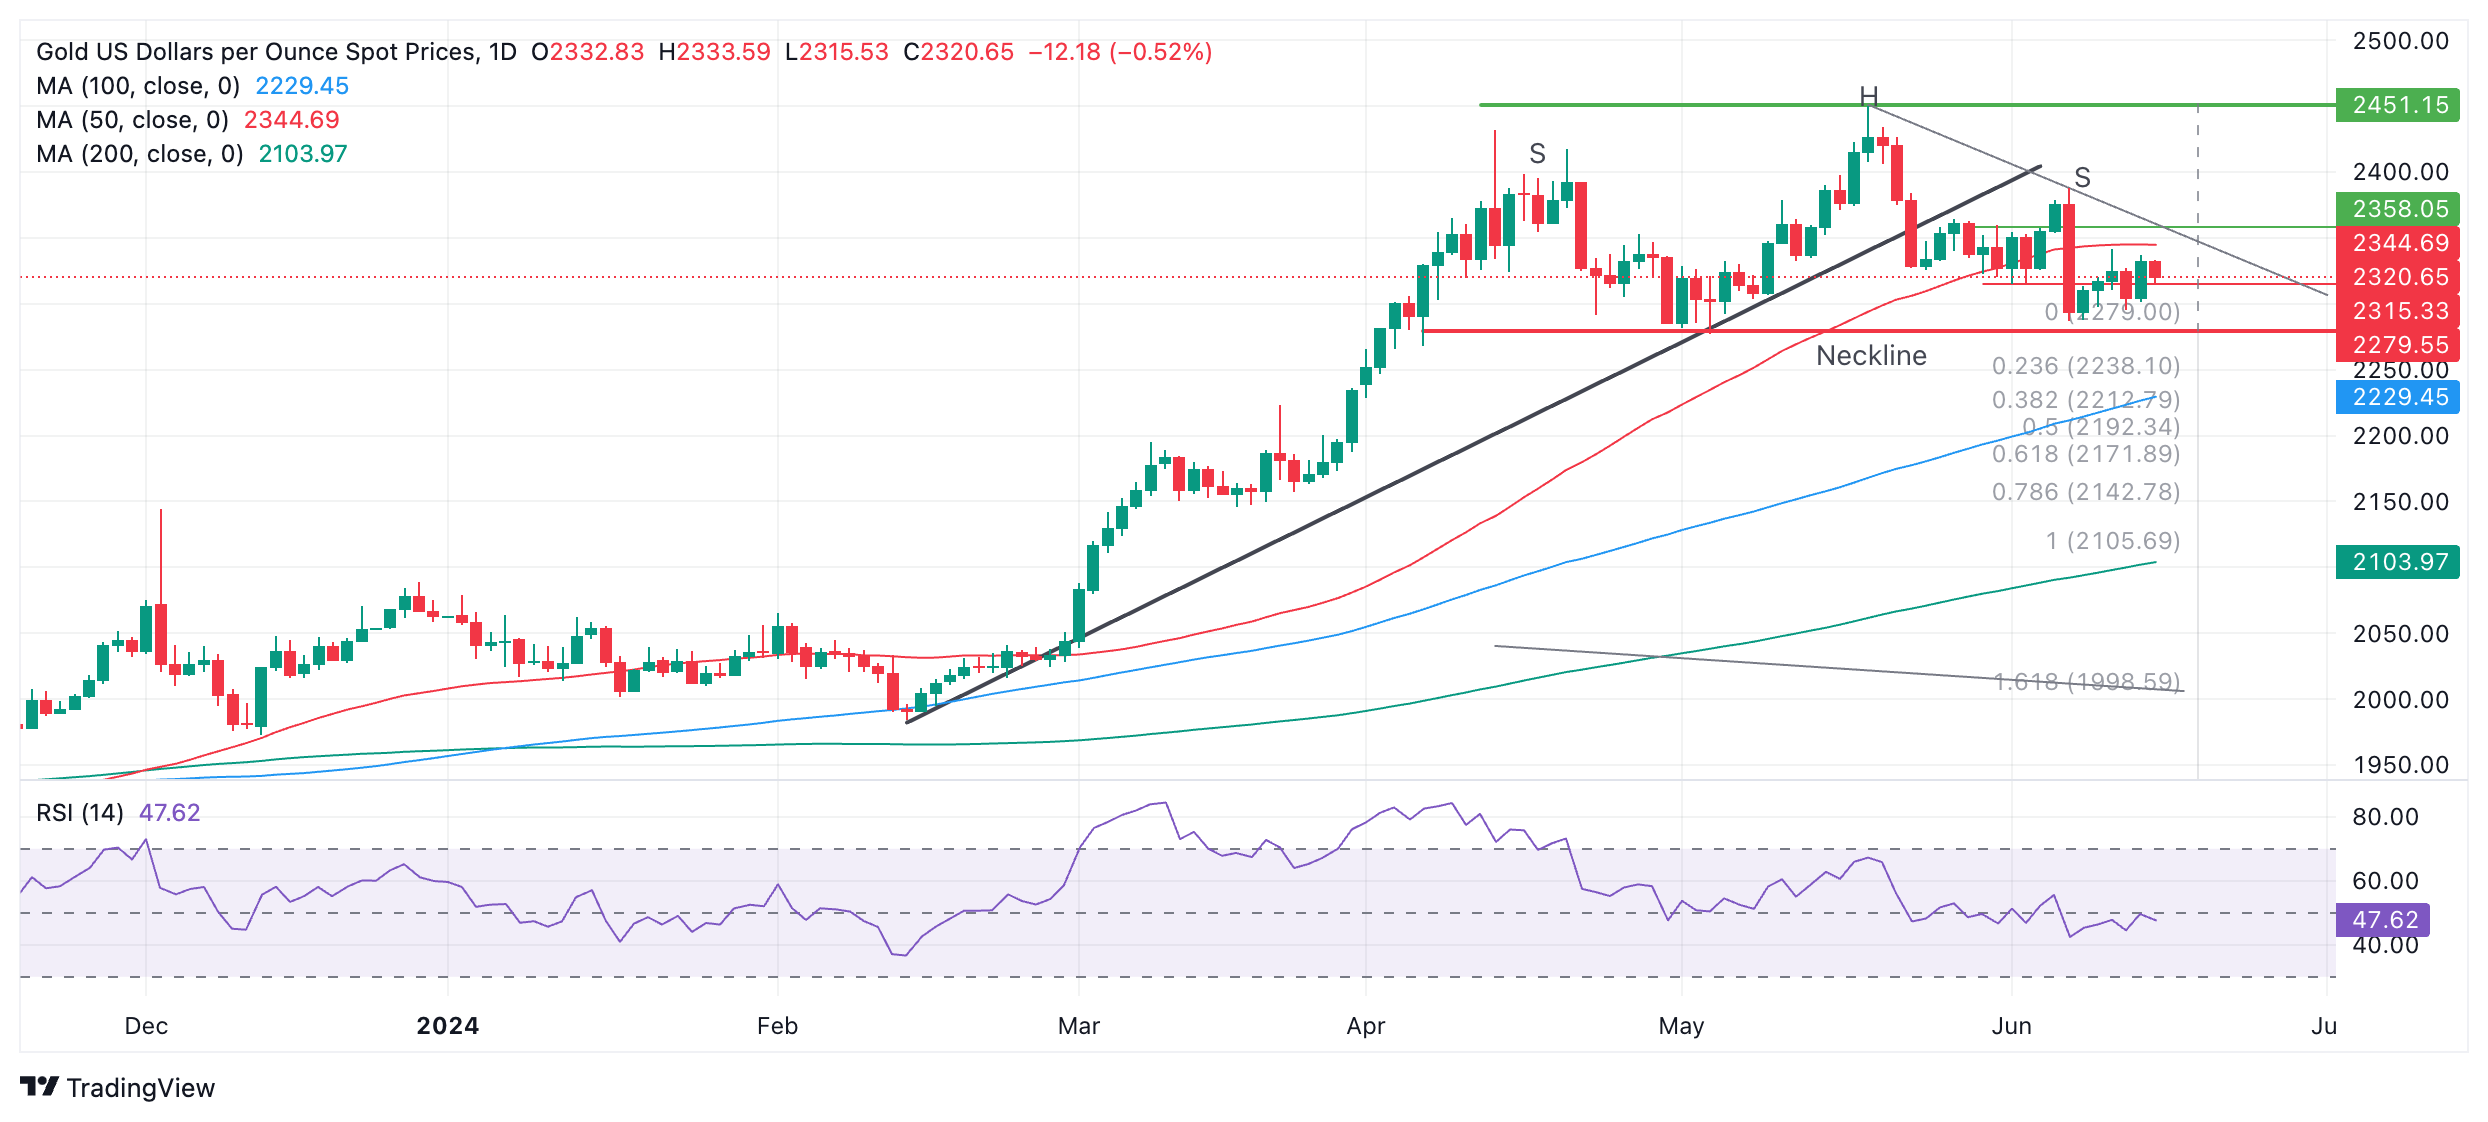
The H&S on Gold has completed a left and right shoulder (labeled “S”) and a “head” (labeled “H”). The so-called “neckline” of the pattern appears to be at the $2,279 support level (red line).
Declining momentum signaled by the Relative Strength Index (RSI) during its development corroborates the pattern.
A decisive break below the neckline would validate the H&S pattern and activate downside targets. The first more conservative target would be $2,171, calculated by taking the 0.618 Fibonacci ratio of the height of the pattern and extrapolating it lower from the neckline. The second target would be at $2,106, the full height of the pattern extrapolated lower.
A break above $2,345, however, would bring the H&S into doubt and could signal a continuation higher, to an initial target at the $2,450 peak.
Economic Indicator
Michigan Consumer Sentiment Index
The Michigan Consumer Sentiment Index, released on a monthly basis by the University of Michigan, is a survey gauging sentiment among consumers in the United States. The questions cover three broad areas: personal finances, business conditions and buying conditions. The data shows a picture of whether or not consumers are willing to spend money, a key factor as consumer spending is a major driver of the US economy. The University of Michigan survey has proven to be an accurate indicator of the future course of the US economy. The survey publishes a preliminary, mid-month reading and a final print at the end of the month. Generally, a high reading is bullish for the US Dollar (USD), while a low reading is bearish.
Read more.Last release: Fri Jun 14, 2024 14:00 (Prel)
Frequency: Monthly
Actual: 65.6
Consensus: 72
Previous: 69.1
Source: University of Michigan
Consumer exuberance can translate into greater spending and faster economic growth, implying a stronger labor market and a potential pick-up in inflation, helping turn the Fed hawkish. This survey’s popularity among analysts (mentioned more frequently than CB Consumer Confidence) is justified because the data here includes interviews conducted up to a day or two before the official release, making it a timely measure of consumer mood, but foremost because it gauges consumer attitudes on financial and income situations. Actual figures beating consensus tend to be USD bullish.
Author

Joaquin Monfort
FXStreet
Joaquin Monfort is a financial writer and analyst with over 10 years experience writing about financial markets and alt data. He holds a degree in Anthropology from London University and a Diploma in Technical analysis.


