Gold rallies on China demand, weaker Dollar
- Gold is extending to fresh all-time highs on news of an increase in demand from China.
- A weaker US Dollar is further propelling the precious metal higher.
- Middle East peace talks have hit an impasse, further increasing geopolitical risk.

Gold (XAU/USD) trades up to a new all-time high in the $2,520s on Tuesday on the back of news of solid demand from China, a weakening US Dollar (in which the precious metal is mostly priced), and continued geopolitical risks stemming from the Middle East, where peace talks are at risk of running aground.
Gold at new high after news of Chinese demand
Gold continues rallying on Tuesday on the back of increased safe-haven demand from China. The People’s Bank of China (PBoC) issued new Gold import quotas to banks which “triggered speculation of a renewed wave of demand,” according to broker SP Angel. Safe-haven demand for Gold in China rose after Chinese 10-year Government Bond yields fell to record lows last week and, as a result, “Chinese buyers are seeking alternative safe-haven protection, with Gold an obvious candidate,” added the broker.
Gold is gaining a further lift as the US Dollar pushes to a new low eight-month low on Tuesday. The US Dollar Index (DXY) fell to 101.76 in early trade – a positive for Gold since the two assets share a high degree of negative correlation.
Gold may be seeing safe-haven demand after an attempt to reach a peace agreement in the Middle East, spearheaded by US Secretary of State Antony Blinken, stalled with Israel ready to agree but Hamas not because it wants the agreement to include a permanent and not a temporary ceasefire as laid out in the current deal. Hamas further ratcheted up tensions by owning up to a recent suicide bomb attack in Tel Aviv. An Iranian all-out attack against Israel also remains an overhead risk factor.
Technical Analysis: Gold moves up towards breakout target
Gold (XAU/USD) extends to new all-time highs after breaking out a range it was trapped in since July. It is on its way to the initial target for the breakout at $2,550, calculated by taking the 0.618 Fibonacci ratio of the range’s height and extrapolating it higher.
XAU/USD 4-hour Chart
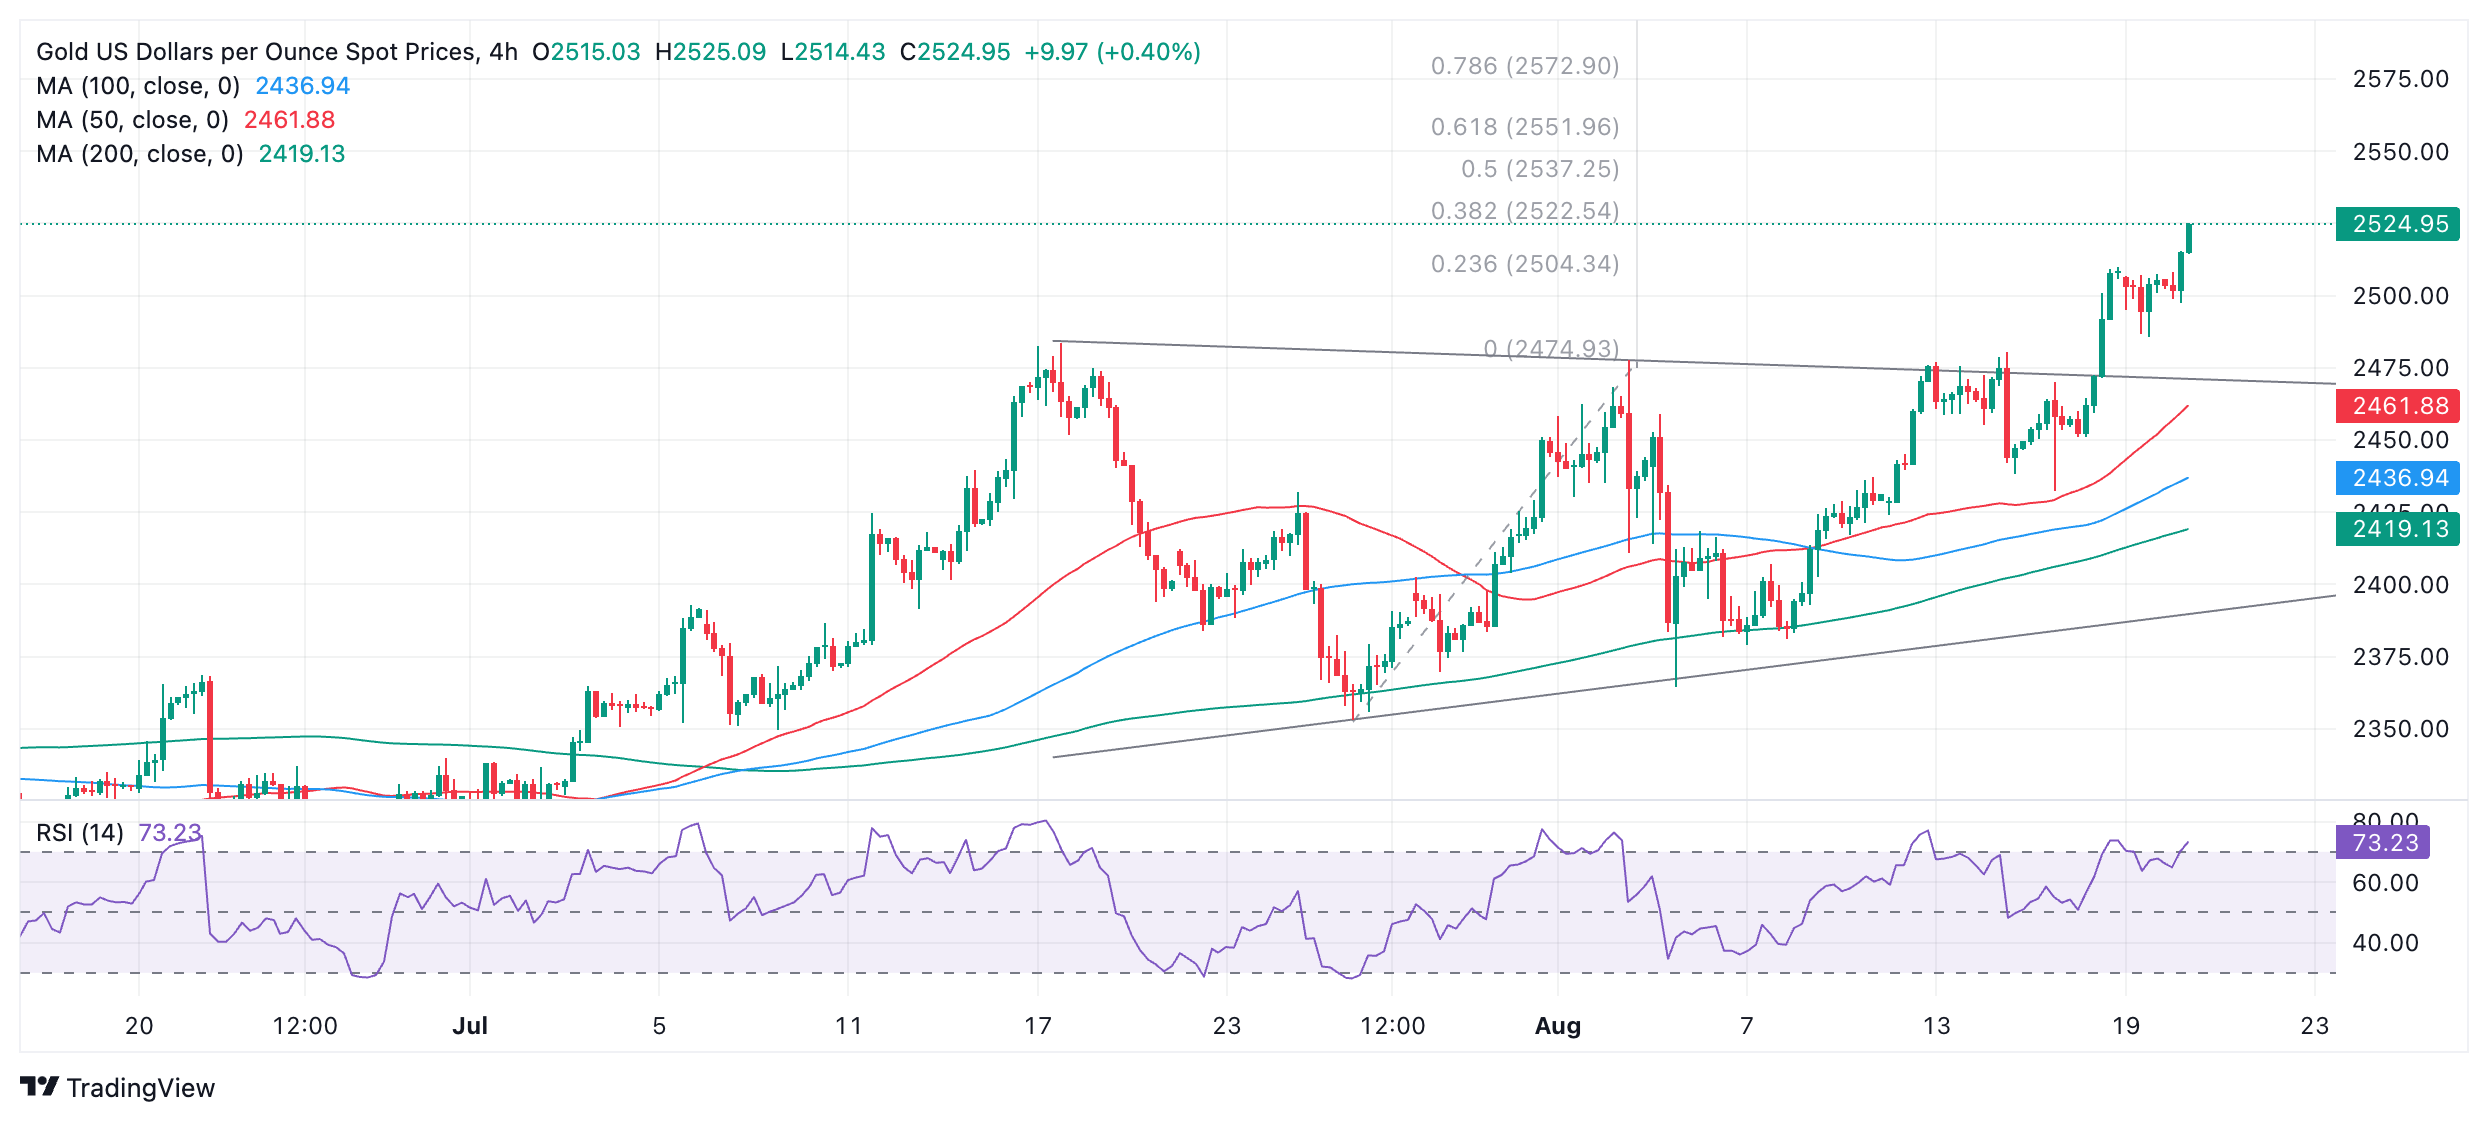
Gold is back in the overbought region of the Relative Strength Index (RSI), however, which indicates a risk of a pullback unfolding. This might drag the Gold price back down before it pushes higher. Such a pullback might be expected to correct to support at around $2,500.
Gold is in a broad uptrend on the short, medium and long-term time frames, however, and given “the trend is your friend”, this uptrend is more likely than not to continue.
Interest rates FAQs
Interest rates are charged by financial institutions on loans to borrowers and are paid as interest to savers and depositors. They are influenced by base lending rates, which are set by central banks in response to changes in the economy. Central banks normally have a mandate to ensure price stability, which in most cases means targeting a core inflation rate of around 2%. If inflation falls below target the central bank may cut base lending rates, with a view to stimulating lending and boosting the economy. If inflation rises substantially above 2% it normally results in the central bank raising base lending rates in an attempt to lower inflation.
Higher interest rates generally help strengthen a country’s currency as they make it a more attractive place for global investors to park their money.
Higher interest rates overall weigh on the price of Gold because they increase the opportunity cost of holding Gold instead of investing in an interest-bearing asset or placing cash in the bank. If interest rates are high that usually pushes up the price of the US Dollar (USD), and since Gold is priced in Dollars, this has the effect of lowering the price of Gold.
The Fed funds rate is the overnight rate at which US banks lend to each other. It is the oft-quoted headline rate set by the Federal Reserve at its FOMC meetings. It is set as a range, for example 4.75%-5.00%, though the upper limit (in that case 5.00%) is the quoted figure. Market expectations for future Fed funds rate are tracked by the CME FedWatch tool, which shapes how many financial markets behave in anticipation of future Federal Reserve monetary policy decisions.
Author

Joaquin Monfort
FXStreet
Joaquin Monfort is a financial writer and analyst with over 10 years experience writing about financial markets and alt data. He holds a degree in Anthropology from London University and a Diploma in Technical analysis.