Gold price advances beyond $2,772 hurdle, eyes multi-month top ahead of US GDP
- Gold price gains positive traction and climbs to a fresh weekly top on Thursday.
- Sliding US bond yields keep the USD bulls on the defensive and lend support.
- The Fed’s hawkish pause and a positive risk tone might cap the XAU/USD pair.

Gold price (XAU/USD) builds on its steady intraday ascent and climbs to a fresh weekly top, around the $2,773-2,774 region during the first half of the European session on Thursday. Despite the Federal Reserve's (Fed) hawkish pause on Wednesday, the uncertainty about US President Donald Trump's policies triggers a fresh leg down in the US Treasury bond yields. This, in turn, keeps the US Dollar (USD) bulls on the defensive and drives flows towards the non-yielding yellow metal.
Apart from this, persistent worries over the potential economic fallout from Trump's trade tariffs turn out to be another factor underpinning the safe-haven Gold price. Meanwhile, the Fed indicated no immediate plans for rate cuts, which, so far, seems to act as a tailwind for the US Dollar (USD). Apart from this, a generally positive risk tone might hold back traders from placing fresh bullish bets around the XAU/USD ahead of the Advance US Q4 GDP report due later this Thursday.
Gold price builds on intraday move up amid declining US bond yields
- The Federal Reserve held interest rates steady on Wednesday and signaled that there would be no rush to lower borrowing costs until inflation and jobs data made it appropriate.
- In the post-meeting press conference, Fed Chair Jerome Powell said that politics would not affect the central bank's interest-rate calls and downplayed expectations for future rate cuts.
- Powell's remarks reaffirmed the notion that rates will remain higher for longer amid caution over US President Donald Trump's protectionist policies, which could reignite inflation.
- The yield on the benchmark 10-year US government bond struggles to build on the post-FOMC bounce from over a one-month low, capping the US Dollar and supporting the Gold price.
- Investors remain concerned about the potential economic fallout from Trump's trade tariffs and protectionist policies, which further underpin the safe-haven precious metal.
- The highly-anticipated European Central Bank (ECB) monetary policy decision this Thursday could infuse some volatility in the markets and drive demand for the XAU/USD.
- The focus will then shift to the release of the closely-watched US Personal Consumption Expenditures (PCE) Price Index – the Fed's preferred inflation gauge – on Friday.
Gold price remains on track to retest multi-month peak, around $2,786
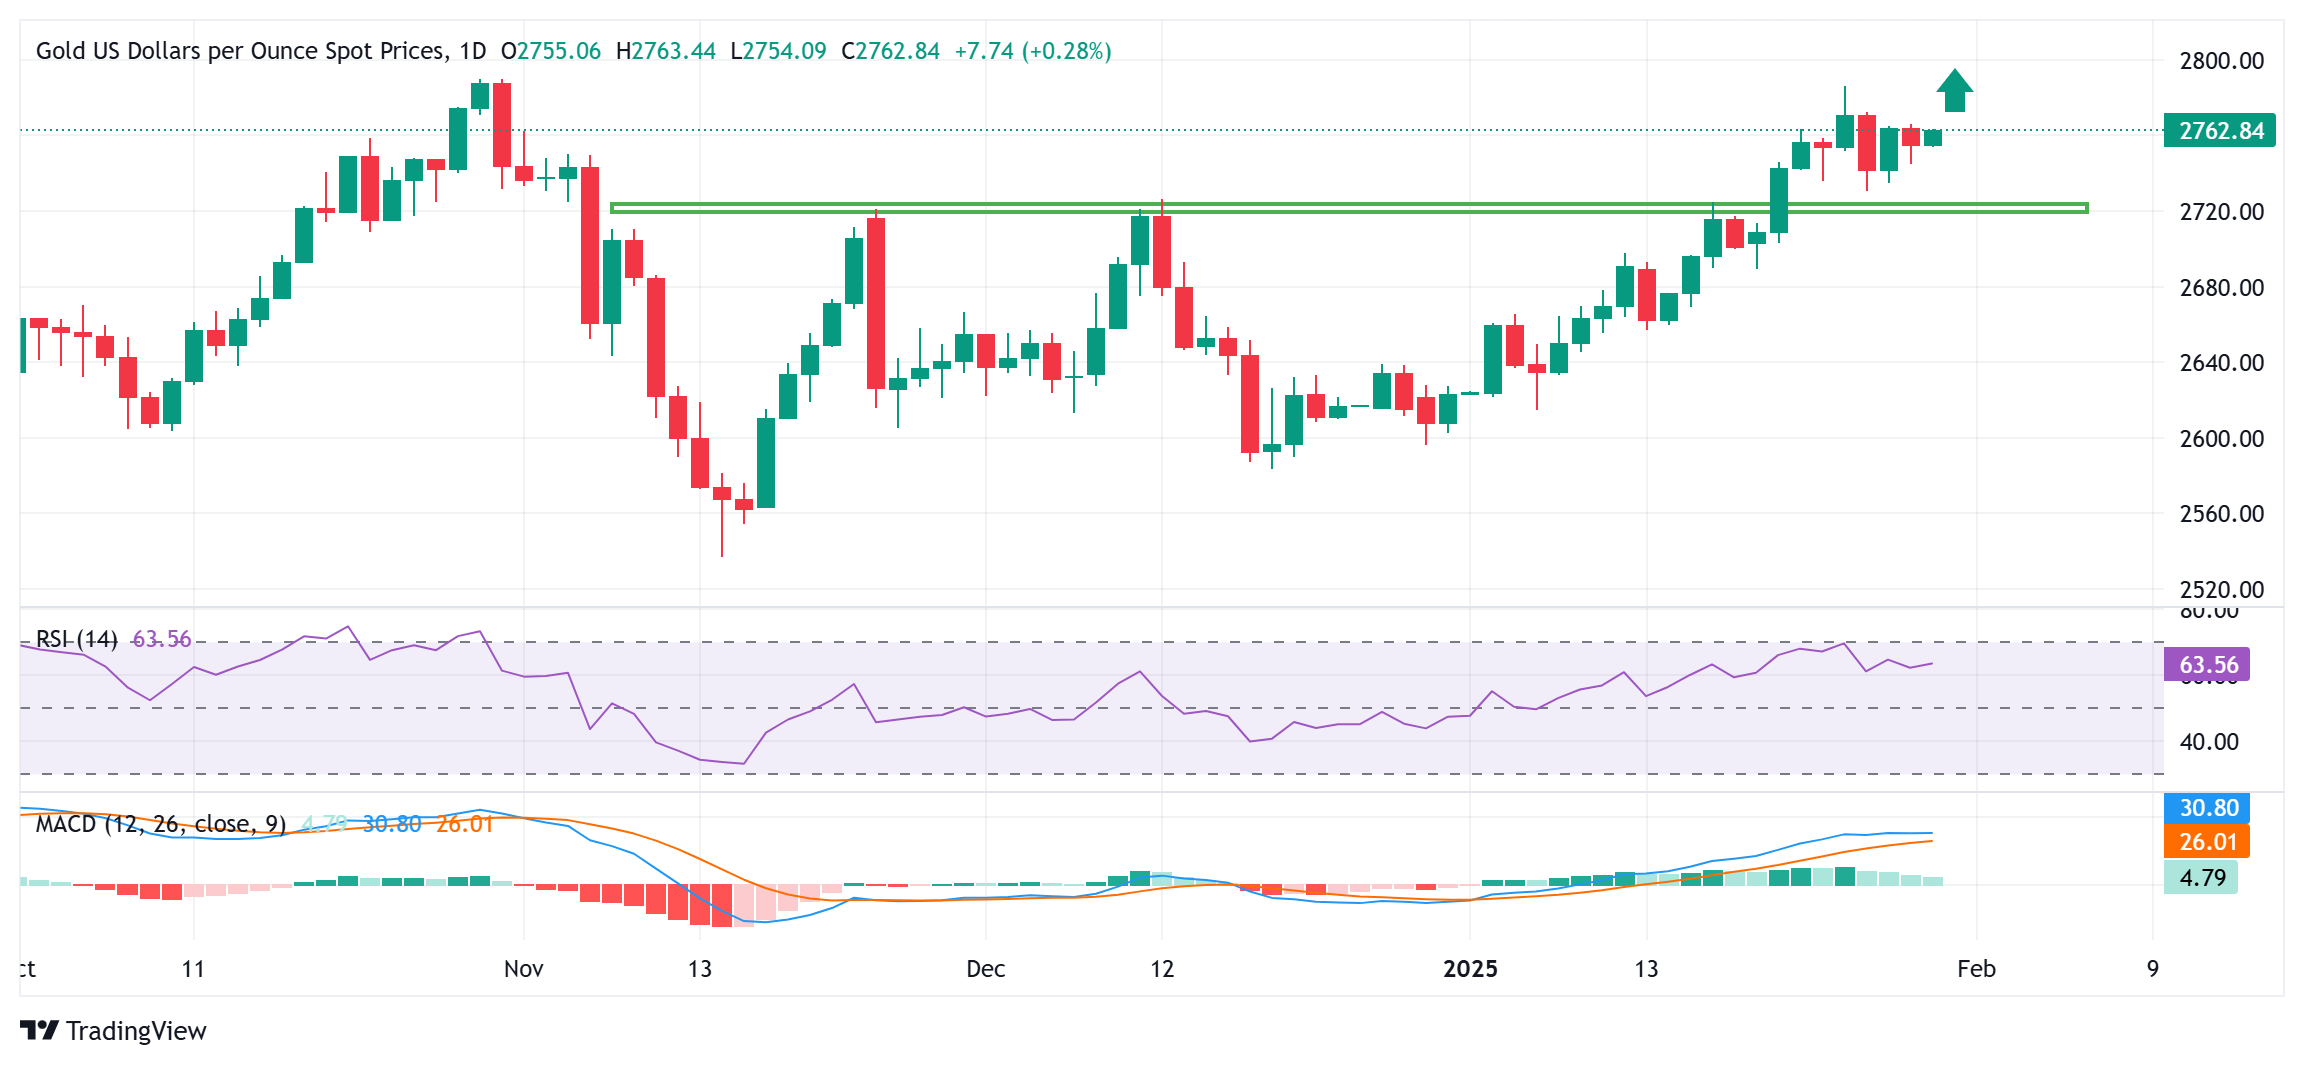
From a technical perspective, the recent breakout through the $2,720-2,725 horizontal barrier and positive oscillators on the daily chart validate the near-term positive outlook for the Gold price. That said, it will still be prudent to wait for a subsequent strength beyond the $2,772-2,773 immediate hurdle before positioning for a move towards the $2,786 area, or the highest level since October 2024 touched last Friday. The momentum could extend further towards the all-time peak, near the $2,790 zone. Some follow-through buying, leading to a move beyond the $2,800 mark, will be seen as a fresh trigger for bulls and pave the way for an extension of a well-established uptrend witnessed over the past month or so.
On the flip side, weakness below the overnight swing low, around the $2,745-2,744 area could be seen as a buying opportunity but limited near the $2,730 region, or the weekly trough touched on Monday. This is followed by the $2,725-2,750 resistance-turned-support, below which the Gold price could accelerate the fall towards the $2,707-2,705 area en route to the $2,684 support zone.
Economic Indicator
Gross Domestic Product Annualized
The real Gross Domestic Product (GDP) Annualized, released quarterly by the US Bureau of Economic Analysis, measures the value of the final goods and services produced in the United States in a given period of time. Changes in GDP are the most popular indicator of the nation’s overall economic health. The data is expressed at an annualized rate, which means that the rate has been adjusted to reflect the amount GDP would have changed over a year’s time, had it continued to grow at that specific rate. Generally speaking, a high reading is seen as bullish for the US Dollar (USD), while a low reading is seen as bearish.
Read more.Next release: Thu Jan 30, 2025 13:30 (Prel)
Frequency: Quarterly
Consensus: 2.6%
Previous: 3.1%
Source: US Bureau of Economic Analysis
The US Bureau of Economic Analysis (BEA) releases the Gross Domestic Product (GDP) growth on an annualized basis for each quarter. After publishing the first estimate, the BEA revises the data two more times, with the third release representing the final reading. Usually, the first estimate is the main market mover and a positive surprise is seen as a USD-positive development while a disappointing print is likely to weigh on the greenback. Market participants usually dismiss the second and third releases as they are generally not significant enough to meaningfully alter the growth picture.
Author

Haresh Menghani
FXStreet
Haresh Menghani is a detail-oriented professional with 10+ years of extensive experience in analysing the global financial markets.

















