Gold Price Forecast: XAUUSD’s path of least resistance appears down, NFP awaited – Confluence Detector
- Gold Price sees a dead cat bounce before the next downside kicks in.
- Hawkish FOMC minutes and recession fears to keep the USD buoyed.
- XAU bulls face a wall of resistance while support levels appear weak.

Recession fears will continue lingering, as the US Fed remains on track for an aggressive tightening path to fight raging inflation. Meanwhile, concerns over renewed covid lockdowns in China and Japan could also accentuate economic slowdown worries. In times of market unrest and panic, the US dollar remains the go-to safety net, which will keep the USD-priced Gold under immense selling pressure. Any temporary reprieve in the bright metal could be viewed as a good selling opportunity, especially with investors awaiting the all-important US Nonfarm Payrolls for fresh bets on the Fed rate hike expectations. The FOMC Minutes on Wednesday revealed that the Fed sees a ‘more restrictive’ policy as likely, as they remain concerned that inflation will become more entrenched.
Also read: Still more inflation expectations nonsense in the latest Fed minutes
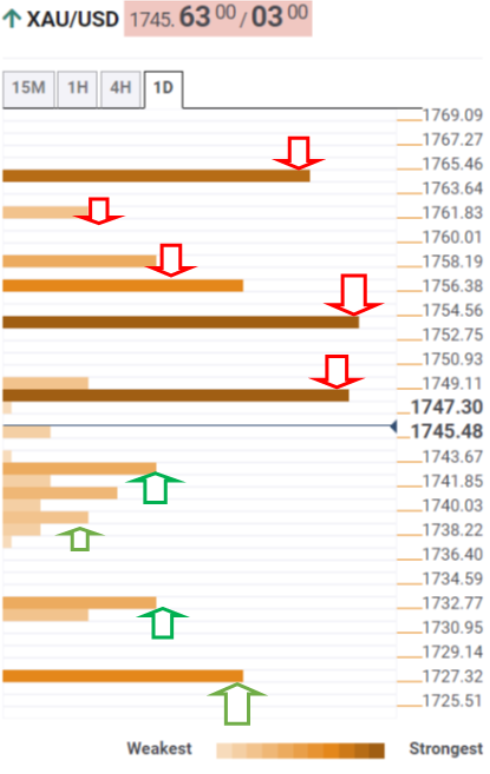
Gold Price: Key levels to watch
The Technical Confluence Detector shows that Gold Price is looking to regain the strong resistance at $1,749 on its road to recovery. That level is the confluence of the SMA5 four-hour and the Fibonacci 38.2% one-day.
Acceptance above the latter will put the pivot point one-month S2 at $1,754 under threat. Further up, the confluence of the Fibonacci 61.8% one-day and the pivot point one-week S2 around $1,757 will hold the guard.
The last line of defense for XAU sellers appears at SMA10 four-hour at $1,762.
On the flip side, the immediate support is seen at the Fibonacci 23.6% one-day at $1,742, below which the previous low four-hour at $1,736 will be tested.
Selling resurgence will threaten the previous day’s low at $1,732, opening floors towards the pivot point one-week S3 at $1,727.
Here is how it looks on the tool
About Technical Confluences Detector
The TCD (Technical Confluences Detector) is a tool to locate and point out those price levels where there is a congestion of indicators, moving averages, Fibonacci levels, Pivot Points, etc. If you are a short-term trader, you will find entry points for counter-trend strategies and hunt a few points at a time. If you are a medium-to-long-term trader, this tool will allow you to know in advance the price levels where a medium-to-long-term trend may stop and rest, where to unwind positions, or where to increase your position size.
Author

Dhwani Mehta
FXStreet
Residing in Mumbai (India), Dhwani is a Senior Analyst and Manager of the Asian session at FXStreet. She has over 10 years of experience in analyzing and covering the global financial markets, with specialization in Forex and commodities markets.


