Gold Price Forecast: XAUUSD bulls look to $1,741 and $1,750 ahead of Fed – Confluence Detector
- Gold price finds renewed demand as the critical Fed week kicks in.
- The US dollar fades its rebound, Treasury yields remain vulnerable.
- XAUUSD sees additional recovery, with eyes on the $1,750 barrier.

Gold price is fluctuating between losses and gains so far this Monday, as investors remain on a cautious footing ahead of this week’s Fed rate hike decision and the US Q2 GDP release. Recession fears are rife after the euro area and the US preliminary S&P Global business PMIs disappointed last Friday. The US bond markets were on a roll higher, which boosted the bullion at the expense of the Treasury yields. Gold traders also remain unnerved, with a slew of earnings reports from the US tech titans, such as Apple Inc. and Alphabet Inc, due on the cards. Investors also look forward to the US Durable Goods data while the Fed is set to hike rates by 75 bps on Wednesday.
Also read: Gold Price Forecast: Will XAUUSD sustain the recovery above $1,700?
Gold Price: Key levels to watch
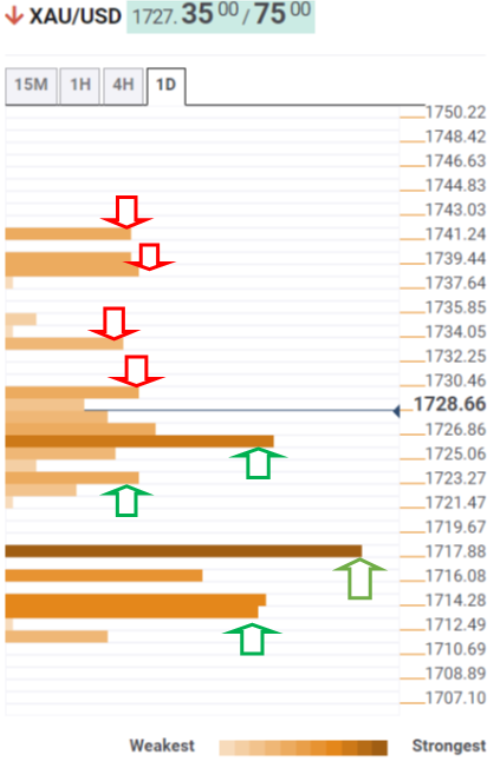
The Technical Confluence Detector shows that the gold price is eyeing a sustained move above the Fibonacci 38.2% one-day at $1,730.
The next upside target is seen at the Fibonacci 23.6% one-day at $1,733. The previous day’s high of $1,739 could then cap the XAUSUD recovery.
Further up, bulls will challenge the pivot point one-day R1 at $1,741 on their way to $1,750 – a psychological barrier.
Alternatively, buyers remain hopeful so long as the Fibonacci 23.6% one-week support of $1,726 is defended.
Bears will then attack the critical Fibonacci 61.8% one-day cushion at $1722.
The confluence of the Fibonacci 38.2% one-week and SMA10 one-day at $1,718 will come to buyers’ rescue.
Friday’s low and the SMA5 one-day at $1,713 will be the level to beat for XAU sellers.
Here is how it looks on the tool
About Technical Confluences Detector
The TCD (Technical Confluences Detector) is a tool to locate and point out those price levels where there is a congestion of indicators, moving averages, Fibonacci levels, Pivot Points, etc. If you are a short-term trader, you will find entry points for counter-trend strategies and hunt a few points at a time. If you are a medium-to-long-term trader, this tool will allow you to know in advance the price levels where a medium-to-long-term trend may stop and rest, where to unwind positions, or where to increase your position size.
Author

Dhwani Mehta
FXStreet
Residing in Mumbai (India), Dhwani is a Senior Analyst and Manager of the Asian session at FXStreet. She has over 10 years of experience in analyzing and covering the global financial markets, with specialization in Forex and commodities markets.















