Gold Price Forecast: XAU/USD stays defensive above $1,700, US ISM Services PMI, full markets eyed


  • Gold price treads water after beginning the key week on softer footing.
  • European energy crisis, US-China tussles weigh on sentiment but US holiday restricts market moves.
  • Fears of recession, hawkish Fed bets underpin DXY strength.
  • US ISM Services PMI for August, US traders’ reaction to latest developments awaited.

Gold price (XAU/USD) remains sidelined at around $1,710, defensive after a softer start to the week, as traders await the key US data and the return of the full markets on Tuesday. That said, the yellow metal’s losses could be linked to the escalating recession fears in Europe and the increasing tension between the US and China, not to forget worries of aggressive rate hikes by the US Federal Reserve (Fed).

Russia’s halting of energy supplies to European worsened the situation for the old continent after it joined the other Group of Seven (G7) leaders to announce a price cap on Moscow’s oil. Also adding to the European energy crisis were dimming hopes of the US-Iran oil deal and the output cut from the Organization of the Petroleum Exporting Countries and allies including Russia, known collectively as OPEC+.

Elsewhere, the US-China tussles over the trade deal and Taiwan escalated on Monday as the Biden Administration announced its intention to continue with the Trump-era tariffs for now. These tariffs were examined for removal and signalled the likely improvement in the relations previously.

Further, the US readiness to sell arms to Taiwan and Taipei’s no-visa entry for some of its friendly country residents, including the US, teased Beijing to utter harsh words for the US-Taiwan ties and increased the tussles.

Alternatively, Friday’s mixed US jobs report and People's Bank of China’s (PBOC) signals for a cut in the foreign exchange reserve requirement ratio (RRR) by 200 basis points (bps) to 6% from 8% beginning September 15, per Reuters, limited the bearish move.

Amid these plays, European equities were lower and the bond yields were firmer while the US Dollar Index (DXY) refreshed its 20-year high.

Looking forward, the full markets’ reactions to the latest recession fears and Friday’s softer US data will be crucial to watch for the XAU/USD traders. Also important will be ISM Services PMI for August, expected 55.5 versus 56.7 prior. Given the looming recession fears and the escalating geopolitical tension, any increase in the data could renew the hawkish Fed bets and favor the gold buyers.

Also read: ISM Services PMI Preview: High bar to help dollar bears pass through and take over

Technical analysis

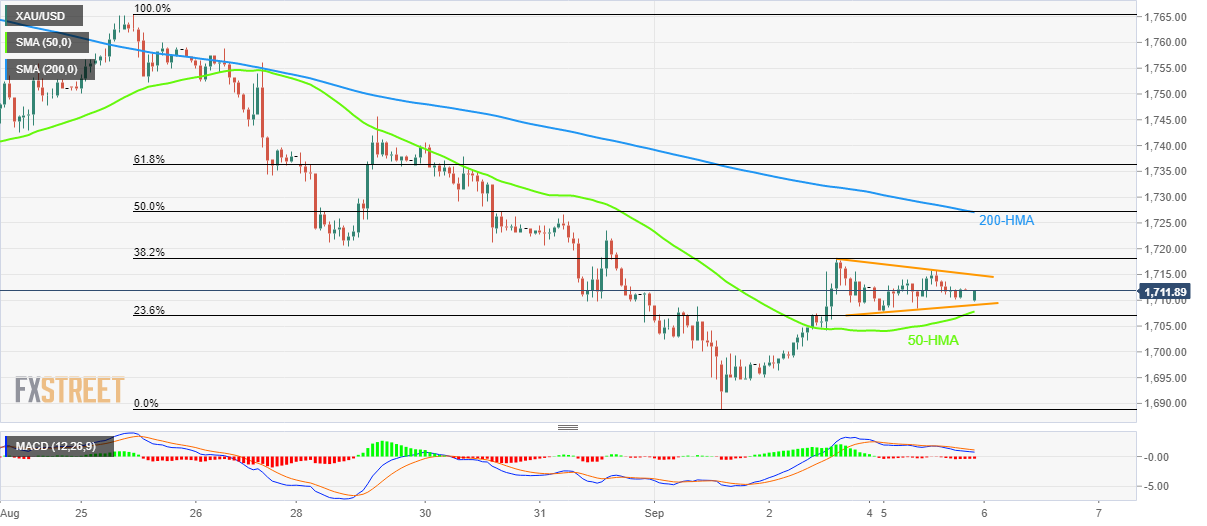
Gold price seesaws inside a two-day-old symmetrical triangle as traders await the return of the full markets.

In addition to the triangle area between $1,709 and $1,715, the 50-HMA and the 200-HMA also restrict short-term XAU/USD moves around $1,707 and $1,727 in that order.

It’s worth noting, however, that the bearish MACD signals and the commodity’s pullback from the 38.2% Fibonacci retracement of the August 25 to September 01 downturn, around $1,718, also keep sellers hopeful.

That said, a downside break of the $1,707 support comprising the 50-HMA won’t hesitate to drag the quote towards the monthly low near $1,688 before highlighting the yearly bottom marked in July, near $1,680.

Meanwhile, recovery remains elusive until crossing the 200-HMA hurdle near $1,727, a break of which could propel the XAU/USD buyers towards the August-end swing high near $1,745.

Gold bears are in control but the room towards the south is limited.

Gold: Hourly chart

Trend: Further weakness expected

Additional important levels

Overview
Today last price 1711.91
Today Daily Change -0.57
Today Daily Change % -0.03%
Today daily open 1712.48
 
Trends
Daily SMA20 1755.27
Daily SMA50 1754.28
Daily SMA100 1807.79
Daily SMA200 1835.21
 
Levels
Previous Daily High 1718.02
Previous Daily Low 1695.1
Previous Weekly High 1745.58
Previous Weekly Low 1688.92
Previous Monthly High 1807.93
Previous Monthly Low 1709.68
Daily Fibonacci 38.2% 1709.26
Daily Fibonacci 61.8% 1703.86
Daily Pivot Point S1 1699.05
Daily Pivot Point S2 1685.61
Daily Pivot Point S3 1676.13
Daily Pivot Point R1 1721.97
Daily Pivot Point R2 1731.45
Daily Pivot Point R3 1744.89


Share: Feed news

Information on these pages contains forward-looking statements that involve risks and uncertainties. Markets and instruments profiled on this page are for informational purposes only and should not in any way come across as a recommendation to buy or sell in these assets. You should do your own thorough research before making any investment decisions. FXStreet does not in any way guarantee that this information is free from mistakes, errors, or material misstatements. It also does not guarantee that this information is of a timely nature. Investing in Open Markets involves a great deal of risk, including the loss of all or a portion of your investment, as well as emotional distress. All risks, losses and costs associated with investing, including total loss of principal, are your responsibility. The views and opinions expressed in this article are those of the authors and do not necessarily reflect the official policy or position of FXStreet nor its advertisers. The author will not be held responsible for information that is found at the end of links posted on this page.

If not otherwise explicitly mentioned in the body of the article, at the time of writing, the author has no position in any stock mentioned in this article and no business relationship with any company mentioned. The author has not received compensation for writing this article, other than from FXStreet.

FXStreet and the author do not provide personalized recommendations. The author makes no representations as to the accuracy, completeness, or suitability of this information. FXStreet and the author will not be liable for any errors, omissions or any losses, injuries or damages arising from this information and its display or use. Errors and omissions excepted.

The author and FXStreet are not registered investment advisors and nothing in this article is intended to be investment advice.

Recommended content


Recommended content

Editors’ Picks

EUR/USD stays near 1.0750 following Monday's indecisive action

EUR/USD stays near 1.0750 following Monday's indecisive action

EUR/USD continues to fluctuate in a tight channel at around 1.0750 after posting small gains on Monday. Disappointing Factory Orders data from Germany limits the Euro's gains as investors keep a close eye on comments from central bankers.

EUR/USD News

AUD/USD drops below 0.6600 after RBA policy announcements

AUD/USD drops below 0.6600 after RBA policy announcements

AUD/USD stays under bearish pressure and trades deep in negative territory slightly below 0.6600. The RBA left the policy settings unchanged as expected but Governor Bullock said that there was no necessity to further tighten the policy.

AUD/USD News

Gold price turns red amid the renewed US dollar demand

Gold price turns red amid the renewed US dollar demand

Gold price trades in negative territory on Tuesday amid the renewed USD demand. A downbeat US jobs data for April prompted speculation of potential rate cuts by the Fed in the coming months. 

Gold News

Bitcoin miner Marathon Digital stock gains ground after listing by S&P Global

Bitcoin miner Marathon Digital stock gains ground after listing by S&P Global

Following Bitcoin miner Marathon Digital's inclusion as an upcoming member of the S&P SmallCap 600, the company's stock received an 18% boost, accompanied by an $800 million rise in market cap.

Read more

The impact of economic indicators and global dynamics on the US Dollar

The impact of economic indicators and global dynamics on the US Dollar

Recent labor market data suggest a cooling economy. The disappointing job creation and rising unemployment hint at a slackening demand for labor, which, coupled with subdued wage growth, could signal a slower economic trajectory. 

Read more

Forex MAJORS

Cryptocurrencies

Signatures