Gold Price Forecast: XAU/USD flirts with $1,915 key support, Fed talks eyed – Confluence Detector
- Gold Price portrays corrective bounce at one-week low amid lackluster markets.
- Broad US Dollar strength, risk aversion prod XAU/USD rebound from key support confluence.
- Hawkish Fed talks, concerns about US economic strength keep Gold sellers hopeful of breaking immediate support.

Gold Price (XAU/USD) struggles to defend the first daily gains in six at the lowest level in more than a week as market players seek additional clues to defend the previous bearish bias about the bullion. In doing so, the XAU/USD traders reassess the latest United States (US) data and Federal Reserve (Fed) clues amid hopes of witnessing a soft landing in the US despite higher rates. The same joins fears of economic slowdown in other major countries to propel the Greenback and exert downside pressure on the Gold Price.
Elsewhere, grim concerns about China, one of the world’s biggest Gold customers, join the Sino-American tussles and upbeat yields to also increase the hardships for the XAU/USD recovery.
That said, a one-week-long European Central Bank (ECB) policymakers’ blackout period and a likely improvement in the second-tier US employment clues seem to highlight today’s Fed talks as the key catalysts.
Also read: Gold Price Forecast: XAU/USD could test $1,900 if key support confluence fails
Gold Price: Key levels to watch
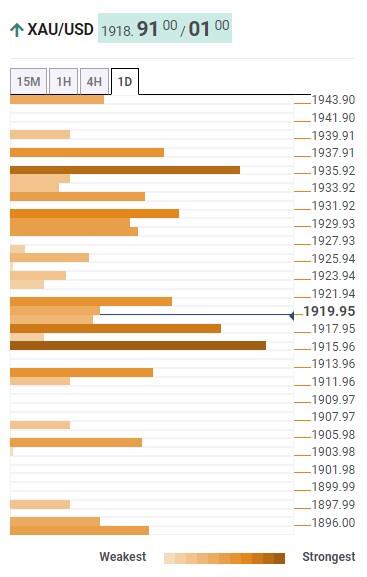
Our Technical Confluence indicator suggests that the Gold Price prods the lower end of the short-term trading range while fading the bearish bias after five-day losing streak. That said, the XAU/USD remains within a strong trading range between $1,935 and $1,915 despite falling in recent days.
That said, the middle band of the Bollinger on one-day joins Fibonacci 38.2% on one-month to highlight $1,915 as the key support.
On the contrary, Fibonacci 61.8% on one-month suggests the $1,935 is an important upside hurdle for the buyers.
It should be noted that the middle band of the Bollinger on four-hour (4H) joins the 50-DMA to highlight $1,930-31 as an extra filter towards the north.
In the same way, the 200-DMA joins the Pivot Point one-week S1 and Fibonacci 23.6% on one-day to signal $1,918 as immediate support.
It’s worth observing that the Fibonacci 38.2% on one-week and 161.8% on one-day also acts as an upside filter near $1,938 before directing the Gold buyers toward the $1,950 hurdle.
Meanwhile, Fibonacci 23.6% on one-month prods the XAU/USD sellers near $1,905 before directing them to the Pivot Point one-week S2 and one-month S1, around $1,895.
Here is how it looks on the tool
About Technical Confluences Detector
The TCD (Technical Confluences Detector) is a tool to locate and point out those price levels where there is a congestion of indicators, moving averages, Fibonacci levels, Pivot Points, etc. If you are a short-term trader, you will find entry points for counter-trend strategies and hunt a few points at a time. If you are a medium-to-long-term trader, this tool will allow you to know in advance the price levels where a medium-to-long-term trend may stop and rest, where to unwind positions, or where to increase your position size.
Author

Anil Panchal
FXStreet
Anil Panchal has nearly 15 years of experience in tracking financial markets. With a keen interest in macroeconomics, Anil aptly tracks global news/updates and stays well-informed about the global financial moves and their implications.


