Gold Price Forecast: XAU/USD prints a fresh high for Asia as USD wobbles
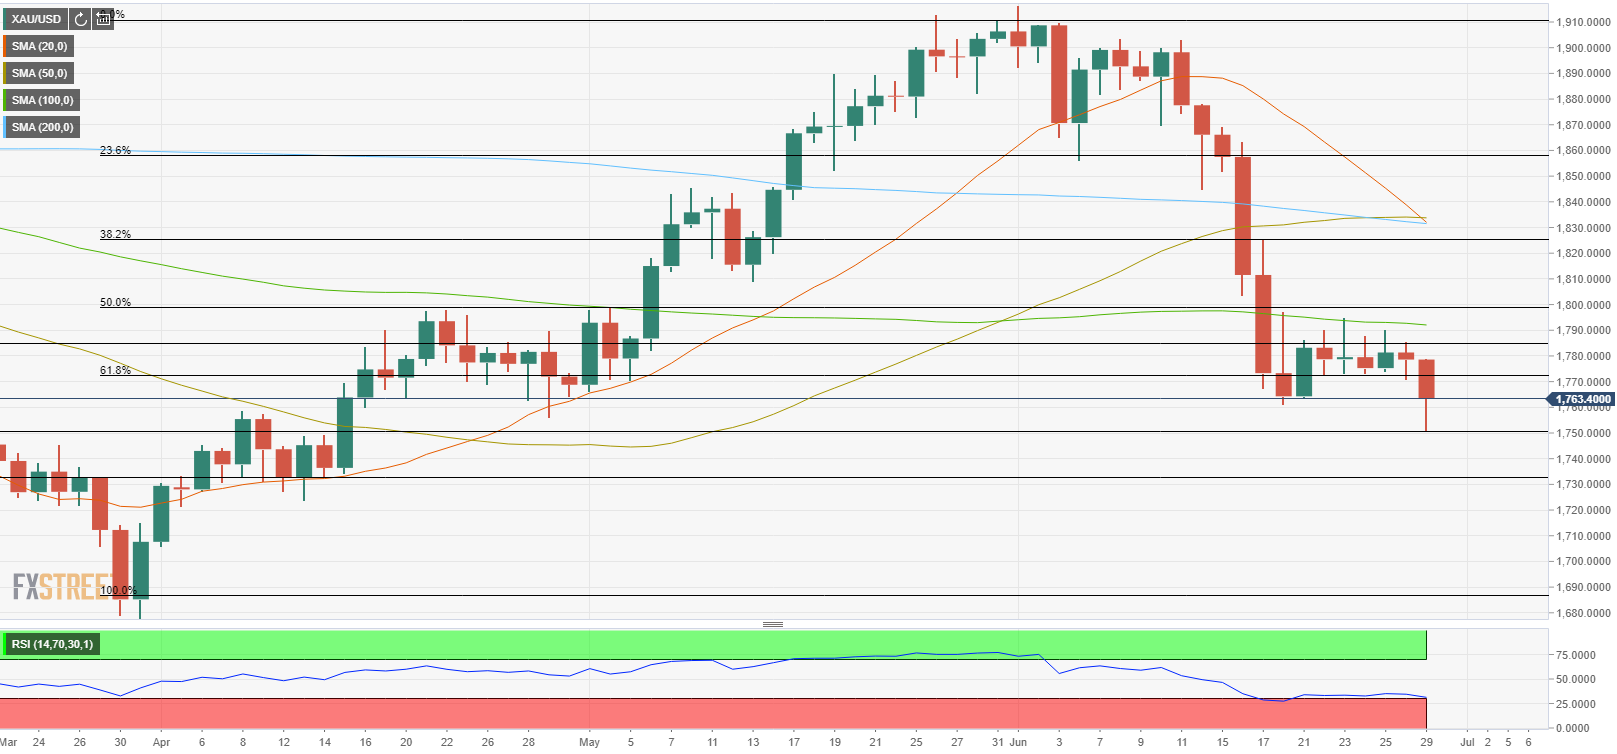
- Gold broke below last week's horizontal range on Tuesday.
- XAU/USD seems to have formed near-term support at $1,750.
- Broad-based USD strength makes it difficult for gold to stage a decisive rebound.

Update: Gold (XAU/USD) is perking up as we move through the Asian session and mid-day markets in Sydney while the greenback wobbles to the lows of the day as measured by the DXY. DXY is currently testing the bull's commitments at the 92 level and has printed a fresh low at the time of writing at 92.015. XAU/USD is on the bid and has made a fresh high of the day at $1,763.98.
The Chinese data passed without making any shakes in the markets, Chinese PMIs beat estimates but are below priors, and the focus will now be on the US ADP Employment Change report ahead of this week's showdown in the Nonfarm Payrolls data.
Update: Gold (XAU/USD) struggles to keep the bounce off a 2.5-month low, seesaws around $1,760, amid the early Asian session on Wednesday. The US dollar strength, amid the coronavirus (COVID-19) woes and upbeat statistics, could be held responsible for gold’s earlier downside. However, the following corrective pullback lacks momentum amid cautious mood ahead of the day’s key data, namely China NBS Manufacturing PMI and US ADP Employment Change.
Also testing the gold prices could be the latest comments from Fed Governor Christopher Waller who said, “It's appropriate to start thinking about pulling back on some of the stimulus.”
It’s worth noting that worsening covid conditions in Asia-Pacific may exert downside pressure on gold while further weakness in Chinese activity can also please the bears. However, soft US ADP figures will signal less pressure on the Fed for the rate hike, favoring a bounce if matched downbeat 600K forecast.
Read: ADP Nonfarm Payrolls Preview: Going contrarian? How to trade this leading indicator
Following last week's consolidation, gold traded in a relatively tight range on Monday. However, rising US Treasury bond yields and the renewed USD strength forced XAU/USD to extend its slide to its lowest level since mid-April at $1,750.
Additionally, technical buying pressure seems to have strengthened after gold broke below the lower limit of last weeks range at $1,760. Although the pair erased a portion of its daily losses, it remains on track to post heavy daily losses and was last seen losing 0.83% on the day at $1,763.
During the European trading hours, the 2% increase seen in the benchmark 10-year US Treasury bond yield provided a boost to the greenback. Reflecting the broad-based USD strength, the US Dollar Index (DXY) climbed to an eight-day high of 92.19. At the moment, the DXY is up 0.22% at 92.08.
Meanwhile, the data from the US showed that the Conference Board's Consumer Confidence Index improved to 127.3 in June from 120 in May. This print surpassed Reuters' estimate of 119 and helped the USD preserve its strength.
There won't be any high-tier macroeconomic data releases in the remainder of the day and the USD's market valuation is likely to remain the primary driver of XAU/USD's action. On Wednesday, the Consumer Price Index (CPI) report from the euro area and the ADP Employment Change data from the US will be looked upon for fresh impetus.
Assessing gold's outlook, "we expect gold to resume its downward trend this week as risk sentiment firms and markets continue to look towards the prospects of tightening monetary conditions from the Fed," said OCBC Bank analysts.
Gold Price Forecast: XAU/USD to continue suffering bearish pressure this week – OCBC.
Gold technical outlook
On the daily chart, the Relative Strength Index (RSI) indicator dropped to 30, suggesting that gold could make a technical correction before the next leg down. On the downside, near-term support seems to have formed at $1,750. A daily close below that level could open the door for additional losses toward $1,730, where the static support from early April is located.
On the other hand, the initial hurdle aligns at $1,785 (upper limit of last week's consolidation channel) ahead of $1,790 (100-day SMA) and $1,800 (psychological level, Fibonacci 50% retracement of April-June uptrend). Unless XAU/USD manages to clear this last resistance, sellers are likely to remain in control.
Additional levels to watch for
Author

Eren Sengezer
FXStreet
As an economist at heart, Eren Sengezer specializes in the assessment of the short-term and long-term impacts of macroeconomic data, central bank policies and political developments on financial assets.


