- Gold price drops as the US dollar attempts a bounce amid cautious mood.
- Treasury yields retreat ahead of the key Fed event this week.
- Gold to stay in consolidation ahead of Jackson Hole.
Gold price is pressurizing daily lows below $1800, as the US dollar is holding onto its recent bounce across the board. The cautious tone on the global markets is keeping the haven demand for the greenback underpinned while weighing on gold price. However, gold’s downside appears limited by the latest retracement in the US Treasury yields. Fading tapering expectations amid a surge in cases of the Delta covid variant globally undermine the yields. Investors turn cautious ahead of the Fed’s Jackson Hole Symposium, starting Thursday, with all eyes on Chair Jerome Powell’s speech for fresh guidance on the central bank’s next policy move.
Read: How to trade the Jackson Hole meeting
Gold Price: Key levels to watch
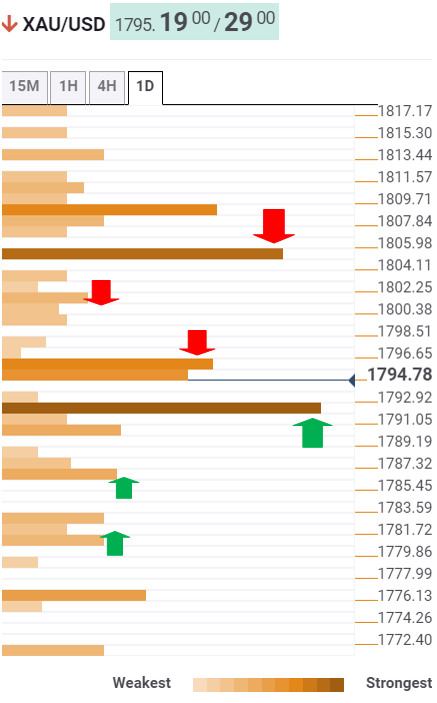
The Technical Confluences Detector shows that gold has bounced off fierce support at $1792, which is the intersection of the SMA50 one-day, SMA5 one-day and Fibonacci 61.8% one-month.
The bright metal confronts a cluster of resistance levels around $1795-$1796 on its tepid recovery. That is the level where the SMA200 four-hour, the previous week’s high and pivot point one-week R1 converge.
If the reversal picks up traction, then the previous day’s low of $1801 could be back on the buyers’ radar.
The next powerful resistance awaits at the Fibonacci 38.2% one-day at $1805.
On the flip side, a sustained break below the abovementioned key support at $1792 could initiate a fresh downswing towards $1786 levels, which is the Fibonacci 38.2% one-week.
Ahead of that cap, the $1790 demand area could come to the rescue of gold bulls.
The last line of defense for the optimists is seen around the $1780 prize zone, the meeting point of the SMA10 one-day and the Fibonacci 61.8% one-week.
Here is how it looks on the tool
About Technical Confluences Detector
The TCD (Technical Confluences Detector) is a tool to locate and point out those price levels where there is a congestion of indicators, moving averages, Fibonacci levels, Pivot Points, etc. If you are a short-term trader, you will find entry points for counter-trend strategies and hunt a few points at a time. If you are a medium-to-long-term trader, this tool will allow you to know in advance the price levels where a medium-to-long-term trend may stop and rest, where to unwind positions, or where to increase your position size.
Information on these pages contains forward-looking statements that involve risks and uncertainties. Markets and instruments profiled on this page are for informational purposes only and should not in any way come across as a recommendation to buy or sell in these assets. You should do your own thorough research before making any investment decisions. FXStreet does not in any way guarantee that this information is free from mistakes, errors, or material misstatements. It also does not guarantee that this information is of a timely nature. Investing in Open Markets involves a great deal of risk, including the loss of all or a portion of your investment, as well as emotional distress. All risks, losses and costs associated with investing, including total loss of principal, are your responsibility. The views and opinions expressed in this article are those of the authors and do not necessarily reflect the official policy or position of FXStreet nor its advertisers. The author will not be held responsible for information that is found at the end of links posted on this page.
If not otherwise explicitly mentioned in the body of the article, at the time of writing, the author has no position in any stock mentioned in this article and no business relationship with any company mentioned. The author has not received compensation for writing this article, other than from FXStreet.
FXStreet and the author do not provide personalized recommendations. The author makes no representations as to the accuracy, completeness, or suitability of this information. FXStreet and the author will not be liable for any errors, omissions or any losses, injuries or damages arising from this information and its display or use. Errors and omissions excepted.
The author and FXStreet are not registered investment advisors and nothing in this article is intended to be investment advice.
Recommended content
Editors’ Picks
EUR/USD stabilizes near 1.0800 as trading action turns subdued
EUR/USD holds steady near 1.0800 on Thursday and remains on track to end the day in negative territory following upbeat macroeconomic data releases from the US. The action in financial markets turn subdued as trading volumes thin out heading into Easter holiday.
GBP/USD extends sideways grind above 1.2600
GBP/USD fluctuates in a narrow channel above 1.2600 on Thursday. The better-than-expected Initial Jobless Claims data from the US and the upward revision to the Q4 GDP growth help the USD stay resilient against its rivals and limits the pair's upside.
Gold pulls away from daily highs, holds above $2,200
Gold retreats from daily highs but holds comfortably above $2,200 in the American session on Thursday. The benchmark 10-year US Treasury bond yield stays near 4.2% after upbeat US data and makes it difficult for XAU/USD to gather further bullish momentum.
XRP price falls to $0.60 support as Ripple ruling doesn’t help Coinbase lawsuit against SEC
XRP programmatic sales ruling by Judge Torres was completely rejected by another US Court that ruled in favor of the SEC in a lawsuit against Coinbase.
Portfolio rebalancing and reflation trades emerge into Q2
Yesterday’s price action pointed at a possible end-of-quarter portfolio rebalancing as the session saw the laggards of the quarter like Apple and Tesla gain, and the stars like Microsoft and Nvidia retreat.