Gold Price Analysis: XAU/USD drops to fresh weekly lows on upbeat US data
- Gold refreshes intraday low inside a choppy weekly move.
- US Treasury yields snap two-week downtrend amid cautious sentiment, lack of major catalysts.
- US ADP, ISM Services PMI can entertain traders ahead of NFP.
- Gold to be an exciting display of technicals.

Update: Gold continued losing ground through the early North American session and dropped to fresh weekly lows, around the $1,885-84 region in reaction to upbeat US macro data. The US dollar added to its strong intraday gains after the ADP report showed that the US private-sector employers added 978K new jobs in May. This was well above the 650K anticipated and April's downwardly revised reading of 654K (742K reported previously). Adding to this, the Initial Weekly Jobless Claims fell more than expected to 385K for the week ended May 28.
The incoming strong economic data further fueled speculations that the Fed would begin tapering its bond-buying program sooner rather than later. This was seen as a key factor that forced investors to cover their USD short-positions, which, in turn, drove flows away from dollar-denominated commodities, including gold. Apart from this, a goodish pickup in the US Treasury bond yields further underpinned the greenback and acted as a headwind for the non-yielding yellow metal.
That said, a sharp pullback in the US equity markets could help limit any deeper losses for the safe-haven XAU/USD. Investors might also refrain from placing aggressive bets, rather prefer to wait for a fresh catalyst from Friday's release of the closely watched US monthly jobs report (NFP). This makes it prudent to wait for some strong follow-through selling before confirming that gold has topped out in the near term and positioning for any meaningful corrective slide.
Update: Gold struggled to capitalize on the previous day's modest gains and met with some fresh supply on Thursday. The intraday downfall was sponsored by a combination of factors and dragged the XAU/USD to fresh weekly lows, around the $1,892 region during the early European session.
Investors have grown nervous about whether a surprisingly stronger US economic data could force the Fed to start tapering its bond-buying program sooner rather than later. This, in turn, prompted some short-covering move around the US dollar and exerted some pressure on dollar-denominated commodities, including gold.
The greenback was further underpinned by a modest uptick in the US Treasury bond yields. This was seen as another factor driving flows away from the non-yielding yellow metal. Bulls seemed rather unimpressed by a softer tone surrounding the equity markets, which tends to benefit safe-haven assets, like gold.
Moving ahead, market participants now look forward to Thursday's US economic docket – featuring the releases of the ADP report on private-sector employment, the Initial Weekly Jobless Claims and ISM Services PMI. This, along with the US bond yields, will influence the USD price dynamics. Apart from this, the broader market risk sentiment will also be looked upon for some short-term trading opportunities around gold.
Previous update: Gold remains pressured towards $1,900, down 0.26% intraday around $1,903, as European traders brace for Thursday’s bell. In doing so, the yellow metal takes clues from the US dollar rebound amid a quiet morning.
Pre-NFP caution could extend range play…
Although gold drops 0.25% intraday, it prints the shallowest weekly performance so far. The reason could be traced to the lack of risk catalysts and a light macro. Above all, traders remain cautious ahead of tomorrow’s Nonfarm Payrolls (NFP) after the last month’s disappointment and hence no major moves could be traced.
In addition to the latest disappointment from the US employment report, mixed clues from the US Federal Reserve (Fed) policymakers and hints of increasing price pressure also put a bid under the safe-haven demand of the US dollar, which in turn weigh on gold prices. Additionally, chatters over a global push to inflate the tax on rich companies, not to forget wealthy Americans, direct traders to the bonds and drag the Treasury yields, also taking the gold prices to the south.
On the positive side, the US-China trade deal and increasing odds of Iran’s rejoining the nuclear treaty could keep the gold bears in check. Further, the UK-Aussie trade deal and hopes of further stimulus from the US, as well as global institutions like the International Monetary Fund (IMF) and the World Health Organizations (WHO) also restrict the bullion’s immediate downside.
Against this backdrop, stock futures print mild gains but the Treasury yields remain sluggish while waiting for the key US ADP Employment Change, an early signal for Friday’s NFP, as well as US ISM Services PMI.
Technical analysis
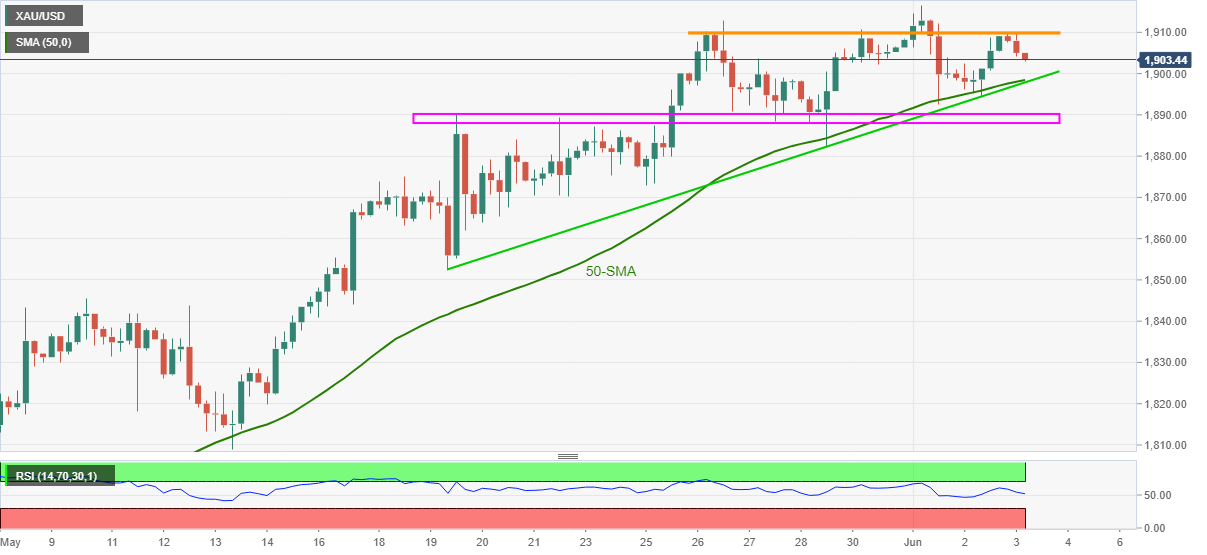
Gold prices justify the failures to cross one-week-old horizontal resistance, around $1,910 while declining towards a confluence of 50-SMA and a fortnight-long support line, close to $1,899.
Although the descending RSI line backs the odds favoring gold’s further weakness, multiple levels marked since May 18 near $1,890-88, should restrict the yellow metal’s further declines.
Should gold bears refrain from stepping back after $1,888, May 19 low and early May tops, near $1,852 and $1,845 respectively, will be on their radars.
Meanwhile, an upside clearance of $1,910 needs a daily closing beyond $1,917 to aim for October 2020 tops surrounding $1,930. Though, any further upside won’t hesitate to direct gold buyers to the yearly top near $1,960.
Gold daily chart
Trend: Further weakness expected
Also read..
Chart of the Week: Gold to be an exciting display of technicals
Gold Price Forecast: Range play likely to extend ahead of NFP on Friday
Author

Anil Panchal
FXStreet
Anil Panchal has nearly 15 years of experience in tracking financial markets. With a keen interest in macroeconomics, Anil aptly tracks global news/updates and stays well-informed about the global financial moves and their implications.

















