Gold Price Analysis: XAU/USD bears face uphill battle even as risk-off mood highlights $1,717 – Confluence Detector

Gold snaps a two-day downtrend, bouncing off weekly low, while taking the bids near $1,733, up 0.37% intraday, ahead of Wednesday’s European session. In doing so, the yellow metal shrugs off US dollar gains and a strong risk-aversion wave.
A lack of clarity over the Fed’s future performance and economic recovery out of the coronavirus (COVID-19) gain major attention of the market bears. Also joining the league are geopolitical concerns surrounding China and vaccine jitters in Asia and Europe.
While portraying the mood, the US 10-year Treasury yields drop below 1.60% for the first time in a week whereas stock futures stay sluggish and the Asian shares remain heavy by the press time.
Looking forward, the yellow metal traders will keep their eyes on the risk catalysts and a heavy calendar comprising preliminary activity numbers for fresh impulse.
Read: S&P 500 Futures seesaw around 3,900 as US Treasury yields refresh one-week low
Gold: Key levels to watch
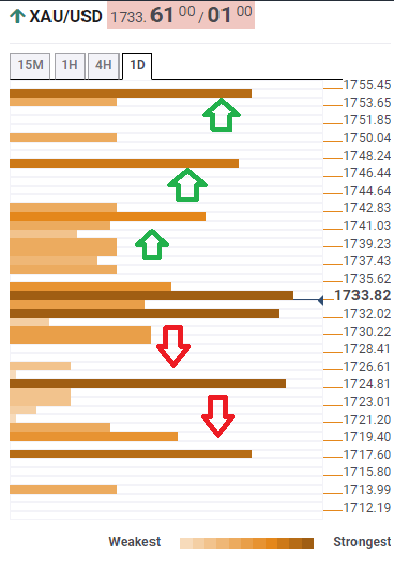
The Technical Confluences Indicator suggests the bears are tiring as the metal confronts a wall of resistance near $1,734-35 comprising 200-SMA on the 15-minutes (15M) formation, previous high on the four-hour (4H), upper Bollinger band on 15M and SMA 15 and 10 on hourly and 4H formation respectively.
Should the bulls manage to cross $1,735, upper Bollinger on the 1H and 38.2% Fibonacci retracement on the weekly (W1) formation around $1,742 will return to the chart.
However, any further upside will be tamed by 23.6% Fibonacci retracement on W1 and upper Bollinger band on 4H, around $1,747. Should gold buyers manage to cross $1,747, the 23.6% Fibonacci retracement on the monthly formation near $1,755 will be the key to watch.
Alternatively, the middle band of the Bollinger on the 1H, 38.2% Fibonacci retracement on the daily formation (D1) and the previous low on 15M restrict the metal’s immediate downside close to $1,732.
It should, however, be noted that the key support is $1,725, per Technical Confluence Indicator, which comprises first support of the weekly pivots and previous low on the D1 formation.
Overall, gold is confronting the upside hurdle even as bears are in a good position.
Here is how it looks on the tool
About Technical Confluences Detector
The TCD (Technical Confluences Detector) is a tool to locate and point out those price levels where there is a congestion of indicators, moving averages, Fibonacci levels, Pivot Points, etc. Knowing where these congestion points are located is very useful for the trader, and can be used as a basis for different strategies.
Author

Anil Panchal
FXStreet
Anil Panchal has nearly 15 years of experience in tracking financial markets. With a keen interest in macroeconomics, Anil aptly tracks global news/updates and stays well-informed about the global financial moves and their implications.


