Gold rallies near 1% after mixed Retail Sales
- Gold price rallies, breaking further, above $2,715.
- Fed rate cut expectations flair up and fueling the Bullion rally.
- Gold sprints away and sets sail for the next important pivotal level at $2,721.

Gold’s price (XAU/USD) is rallying on Thursday in the aftermath of mixed Retail Sales and disinflationary Consumer Price Index (CPI) release on Wednesday. The rally this Thursday has been picking up speed after the actual Retail Sales number for December missed the mark by coming in at 0.4%, missing the 0.6% estimate, while the previous 0.7% got revised up to 0.8%. Gold has broken through the first big pivotal level at 2,708.00 and is on its way to $2,720.
While headline CPI accelerated compared to the previous month, core inflation rose at a slower pace than in November, which increased the probability of a 25 basis point (bps) rate cut by the Federal Reserve (Fed) in June. According to the CME FedWatch tool, the odds of interest rates being lower than current levels after the June meeting stand at 63.8%, compared to 57.3% before the inflation data and 51.4% on Monday.
Daily digest market movers: US yields are the canary in the coal mine
- Despite several Federal Reserve speakers on Wednesday, officials did not communicate many market-moving comments about whether market expectations were wrong-footed or in line with the Fed’s policy.
- Retail Sales for December came in softer at 0.4% against the expected 0.6% month-on-month increase compared to 0.7% in the previous month. That same 0.7% got revised up to 0.8%.
- South African rescue workers retrieved 78 bodies from a disused gold mine where hundreds of illegal extractors have been involved in a months-long standoff with the authorities, Bloomberg reports.
- The US 10-year yield is trading around 4.670%, over 2.5% lower than its peak performance this week on Tuesday at 4.807%.
Technical Analysis: Getting hot, nearly overheating
Gold bulls face their first litmus test on the upside on Thursday, with some heavy resistance coming in around the pivotal level of $2,708, followed by $2,721. The Relative Strength Index (RSI) is steepening quite quickly in the daily chart. Risk of any overheating in the RSI momentum indicator by the time Bullion hits that $2,720 area could see a quick correction back to $2,680.
The first support is the descending trendline in the pennant chart formation, which has been discussed several times in the past few days. That level is currently around $2,671. In case more downside occurs, the 55-day Simple Moving Average (SMA) at $2,648 is the next support, followed by the 100-day SMA at $2,640.
On the upside, the October 23 low at $2,708 is the key pivotal level to watch. Once that level is cleared, $2,721, which is a sort of a double top in November and December last year, is rapidly approaching. In case Bullion powers through that level, the all-time high of $2,790 is the key upside barrier.
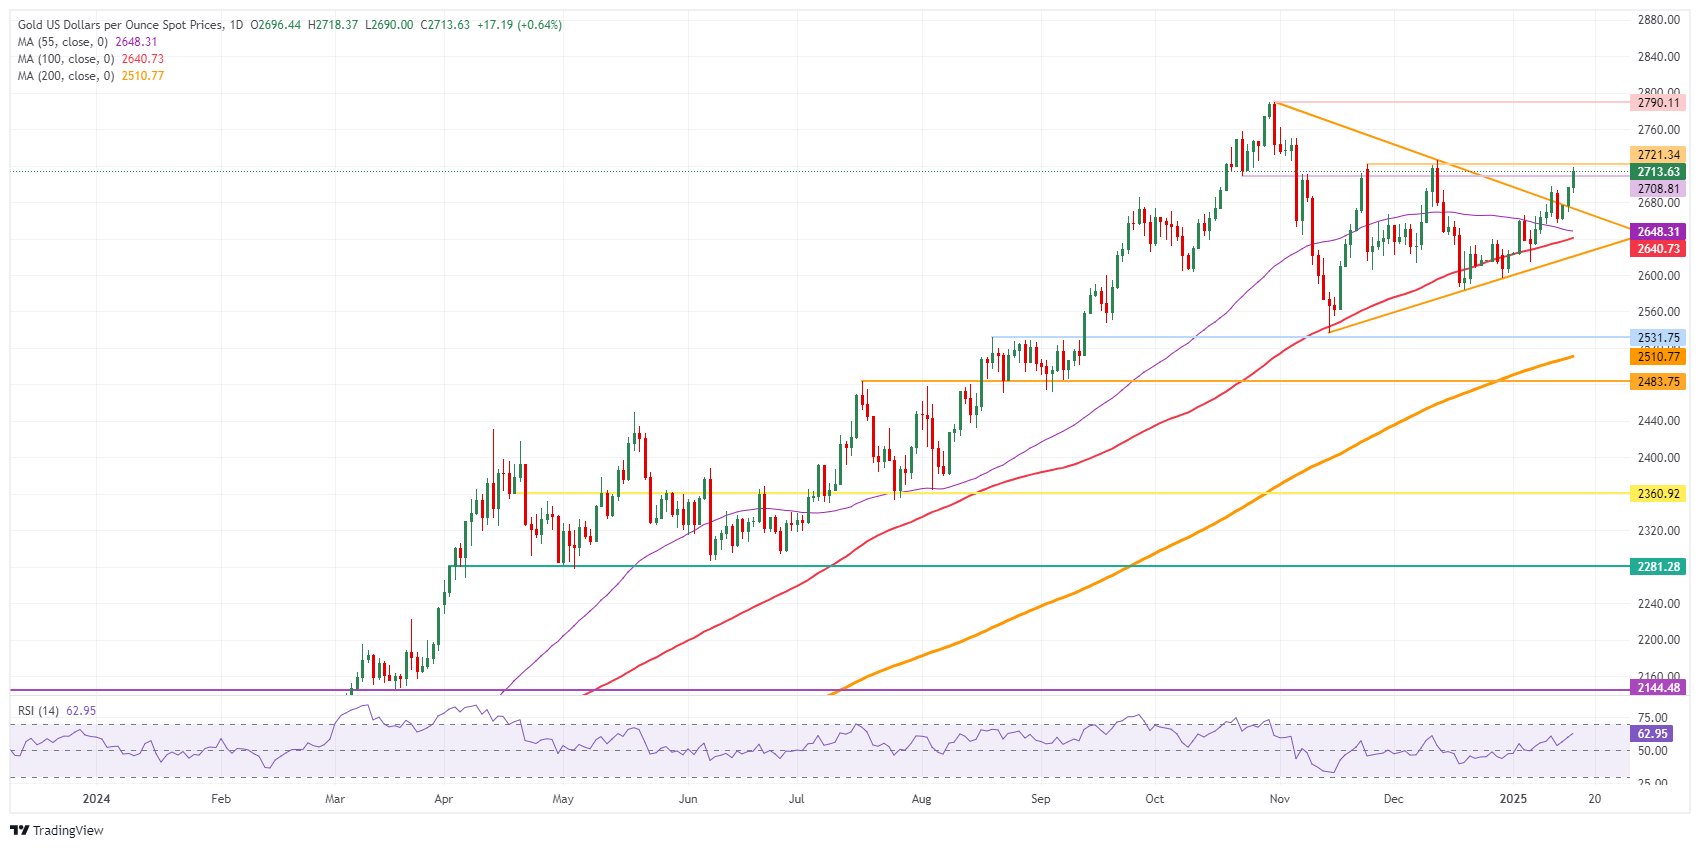
XAU/USD: Daily Chart
Gold FAQs
Gold has played a key role in human’s history as it has been widely used as a store of value and medium of exchange. Currently, apart from its shine and usage for jewelry, the precious metal is widely seen as a safe-haven asset, meaning that it is considered a good investment during turbulent times. Gold is also widely seen as a hedge against inflation and against depreciating currencies as it doesn’t rely on any specific issuer or government.
Central banks are the biggest Gold holders. In their aim to support their currencies in turbulent times, central banks tend to diversify their reserves and buy Gold to improve the perceived strength of the economy and the currency. High Gold reserves can be a source of trust for a country’s solvency. Central banks added 1,136 tonnes of Gold worth around $70 billion to their reserves in 2022, according to data from the World Gold Council. This is the highest yearly purchase since records began. Central banks from emerging economies such as China, India and Turkey are quickly increasing their Gold reserves.
Gold has an inverse correlation with the US Dollar and US Treasuries, which are both major reserve and safe-haven assets. When the Dollar depreciates, Gold tends to rise, enabling investors and central banks to diversify their assets in turbulent times. Gold is also inversely correlated with risk assets. A rally in the stock market tends to weaken Gold price, while sell-offs in riskier markets tend to favor the precious metal.
The price can move due to a wide range of factors. Geopolitical instability or fears of a deep recession can quickly make Gold price escalate due to its safe-haven status. As a yield-less asset, Gold tends to rise with lower interest rates, while higher cost of money usually weighs down on the yellow metal. Still, most moves depend on how the US Dollar (USD) behaves as the asset is priced in dollars (XAU/USD). A strong Dollar tends to keep the price of Gold controlled, whereas a weaker Dollar is likely to push Gold prices up.
Author

Filip Lagaart
FXStreet
Filip Lagaart is a former sales/trader with over 15 years of financial markets expertise under its belt.

















