GBP/USD sticks to familiar territory ahead of a quiet week
- GBP/USD struggled to make headway in either direction on Monday.
- Traders are taking a breather before key US inflation data.
- UK economic data is thinly-represented on the economic calendar this week.

GBP/USD paddled in a tight circle near 1.2750 on Monday, kicking off a new trading week by sticking close to where it ended the previous one. Key US Consumer Price Index (CPI) inflation data is due during the midweek market session. Pound Sterling traders can expect to fall on the mercy of broad-market sentiment with a crimped economic calendar on the UK side.
Monday was a low-key affair overall for Cable traders. Bank of England (BoE) Deputy Governor and head of Markets and Banking Sir Dave Ramsden noted early Monday that the BoE must remain “vigilant” in the face of increased uncertainty regarding the UK’s economic outlook. The BoE Deputy Governor’s word fell on mostly uninterested ears.
The Federal Reserve (Fed) Bank of New York released its latest summary of consumer survey results during Monday’s American market session, noting that US consumers are riding a tricky line with their economic expectations. According to the NY Fed, US consumers expect a suddenly-improved financial situation for themselves and the federal government, with respondents reporting a sea change in their expectations to afford debt and credit conditions following the re-election of former US President Donald Trump. The same pool of respondents also sharply reduced their expectations for future government borrowing levels.
Further complicating the matter for US consumers, the NY Fed’s survey revealed that the same body of surveyed consumers also raised their expectations of future inflation again, with the average respondent expecting inflation to reaccelerate to 3.0% by next November.
US session traders will be looking ahead to a fresh print of US Consumer Price Index (CPI) inflation slated for Wednesday, with a thin docket on the offering for the early week. US CPI inflation is expected to tick up again on an annualized basis in November. Median market forecasts expect Wednesday’s US CPI inflation to rise to 2.7% YoY compared to October’s 2.6%.
GBP/USD price forecast
The GBP/USD daily chart showcases a bearish bias in the medium term, with the pair trading below both its 50-day EMA at 1.2831 and 200-day EMA at 1.2827. After a sharp sell-off in early November, the pair found support near the 1.2550 region, marking a key low. Since then, a corrective rally has taken place, but upside momentum has been capped near the 1.2750–1.2800 area, which coincides with previous support-turned-resistance levels and the approaching 50-day EMA.
The most recent candle highlights indecision, as the pair attempted to climb higher but closed slightly above the previous day’s close at 1.2749, reflecting only marginal bullish strength. The upper wick on the candle suggests selling pressure remains present near the 1.2800 resistance zone. A sustained break above this area could signal further recovery, with potential targets at the 1.2900 psychological level. On the downside, failure to maintain levels above 1.2700 could reexpose the pair to downside risks, with initial support at 1.2600 and then at the recent swing low of 1.2550.
The MACD indicator shows early signs of bullish divergence, as the MACD line continues to edge higher, moving closer to the signal line. While this indicates fading bearish momentum, it is insufficient to confirm a reversal unless GBP/USD clears the key resistance near the 50-day EMA. Traders should monitor price action closely, as a rejection from current levels could reinforce the broader downtrend, while a breakout above 1.2830 would improve the pair’s near-term technical outlook.
GBP/USD daily chart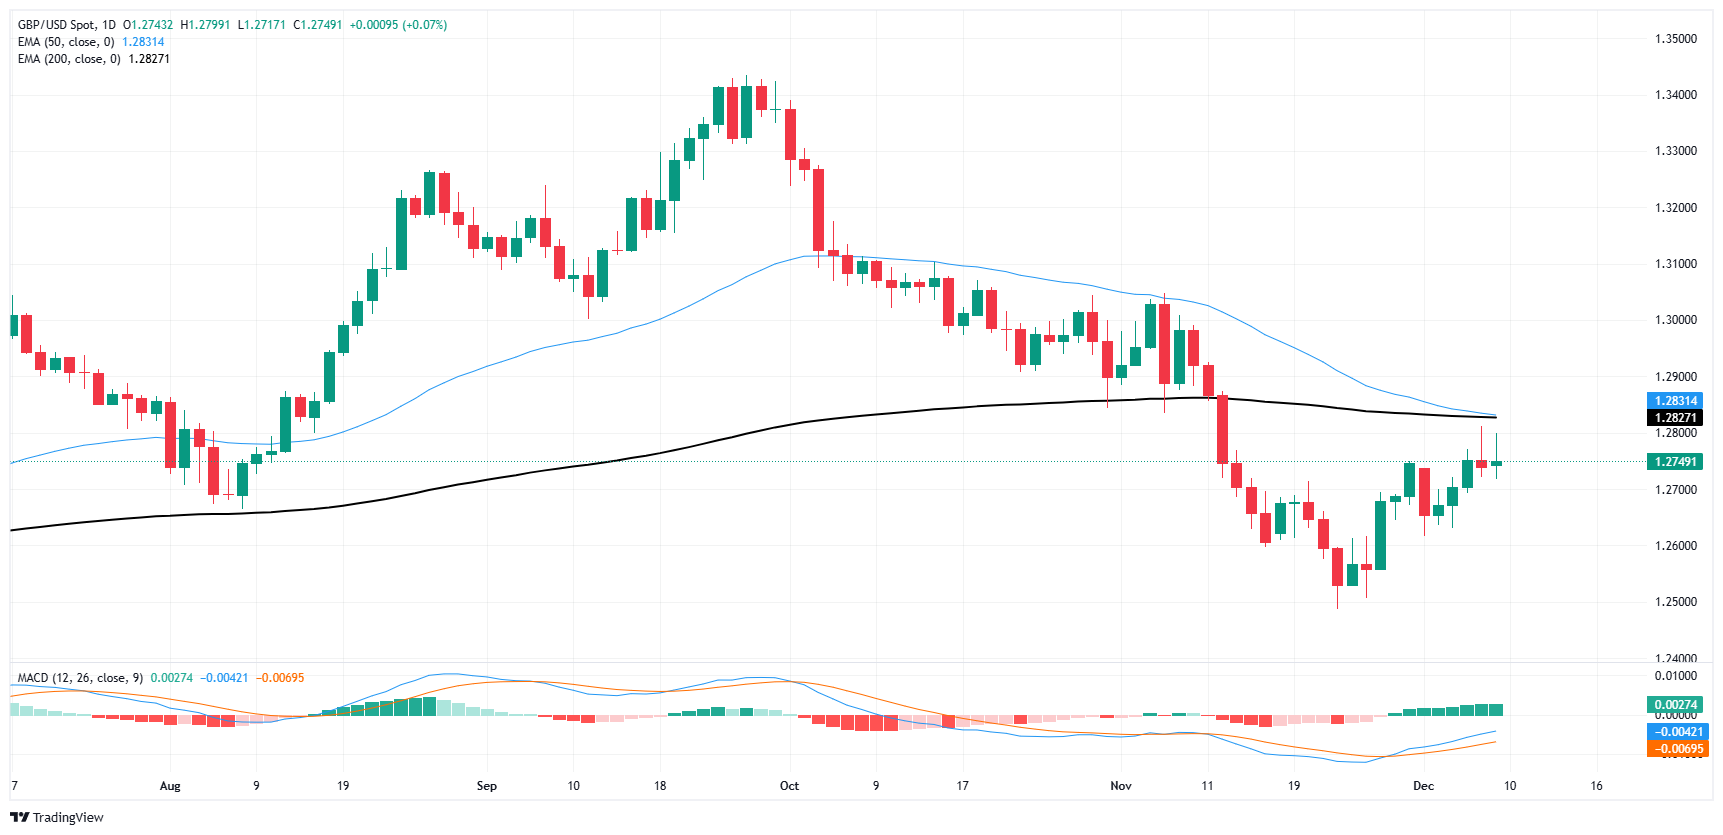
Pound Sterling FAQs
The Pound Sterling (GBP) is the oldest currency in the world (886 AD) and the official currency of the United Kingdom. It is the fourth most traded unit for foreign exchange (FX) in the world, accounting for 12% of all transactions, averaging $630 billion a day, according to 2022 data. Its key trading pairs are GBP/USD, also known as ‘Cable’, which accounts for 11% of FX, GBP/JPY, or the ‘Dragon’ as it is known by traders (3%), and EUR/GBP (2%). The Pound Sterling is issued by the Bank of England (BoE).
The single most important factor influencing the value of the Pound Sterling is monetary policy decided by the Bank of England. The BoE bases its decisions on whether it has achieved its primary goal of “price stability” – a steady inflation rate of around 2%. Its primary tool for achieving this is the adjustment of interest rates. When inflation is too high, the BoE will try to rein it in by raising interest rates, making it more expensive for people and businesses to access credit. This is generally positive for GBP, as higher interest rates make the UK a more attractive place for global investors to park their money. When inflation falls too low it is a sign economic growth is slowing. In this scenario, the BoE will consider lowering interest rates to cheapen credit so businesses will borrow more to invest in growth-generating projects.
Data releases gauge the health of the economy and can impact the value of the Pound Sterling. Indicators such as GDP, Manufacturing and Services PMIs, and employment can all influence the direction of the GBP. A strong economy is good for Sterling. Not only does it attract more foreign investment but it may encourage the BoE to put up interest rates, which will directly strengthen GBP. Otherwise, if economic data is weak, the Pound Sterling is likely to fall.
Another significant data release for the Pound Sterling is the Trade Balance. This indicator measures the difference between what a country earns from its exports and what it spends on imports over a given period. If a country produces highly sought-after exports, its currency will benefit purely from the extra demand created from foreign buyers seeking to purchase these goods. Therefore, a positive net Trade Balance strengthens a currency and vice versa for a negative balance.
Author

Joshua Gibson
FXStreet
Joshua joins the FXStreet team as an Economics and Finance double major from Vancouver Island University with twelve years' experience as an independent trader focusing on technical analysis.


