|

GBP/USD Price Analysis: Fails to justify bullish spinning top near multi-day low around 1.1850

  • GBP/USD retreats from intraday high, fades bounce off the lowest levels since late November 2022.
  • Bearish MACD signals, sustained trading below the key support line and 200-DMA favor sllers.
  • Buyers lack conviction below 1.2150, one-month-old descending trend line adds to the upside filter.

GBP/USD struggles to extend the previous day’s corrective bounce off the lowest levels since November 21, 2022, making rounds to 1.1850 on Thursday morning in Asia.

In doing so, the Cable pair fails to justify the previous day’s bullish candlestick on the daily chart, namely the bullish spinning top.

The reason could be linked to the pair’s sustained downside break of a 15-week-old ascending trend line, previous support near 1.1935, as well as the 200-DMA breakdown. Also adding strength to the downside bias are the bearish MACD signals.

That said, the GBP/USD quote’s fresh weakness could aim for the 50% Fibonacci retracement level of November 2022 to January 2023 upside, near 1.1800.

Following that, a slump toward the 61.8% Fibonacci retracement level surrounding 1.1645, also known as the golden ratio, can’t be ruled out.

Meanwhile, the 200-DMA hurdle of around 1.1900 restricts immediate GBP/USD recovery before highlighting the support-turned-resistance line close to 1.1935.

Even if the Cable pair crosses the 1.1935 hurdle, a downward-sloping resistance line from early February, near 1.2055 could act as the last defense of the GBP/USD bears.

To sum up, GBP/USD remains on the bear’s radar despite the latest rebound, as well as posting the bullish candlestick.

GBP/USD: Daily chart
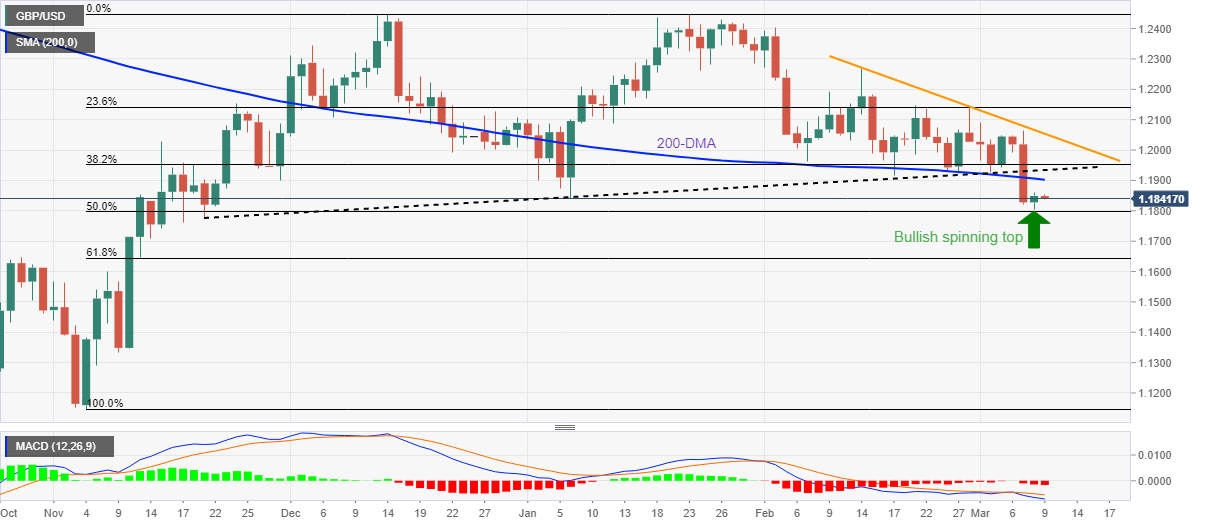
Trend: Bearish

Additional important levels

Overview
Today last price1.1845
Today Daily Change-0.0004
Today Daily Change %-0.03%
Today daily open1.1849
 
Trends
Daily SMA201.2025
Daily SMA501.2133
Daily SMA1001.2003
Daily SMA2001.1906
 
Levels
Previous Daily High1.186
Previous Daily Low1.1803
Previous Weekly High1.2143
Previous Weekly Low1.1922
Previous Monthly High1.2402
Previous Monthly Low1.1915
Daily Fibonacci 38.2%1.1838
Daily Fibonacci 61.8%1.1824
Daily Pivot Point S11.1814
Daily Pivot Point S21.178
Daily Pivot Point S31.1758
Daily Pivot Point R11.1871
Daily Pivot Point R21.1894
Daily Pivot Point R31.1928

Author

Anil Panchal

Anil Panchal

FXStreet

Anil Panchal has nearly 15 years of experience in tracking financial markets. With a keen interest in macroeconomics, Anil aptly tracks global news/updates and stays well-informed about the global financial moves and their implications.

More from Anil Panchal
Share:

Markets move fast. We move first.

Orange Juice Newsletter brings you expert driven insights - not headlines. Every day on your inbox.

By subscribing you agree to our Terms and conditions.

Editor's Picks

EUR/USD rebounds after falling toward 1.1700

EUR/USD gains traction and trades above 1.1730 in the American session, looking to end the week virtually unchanged. The bullish opening in Wall Street makes it difficult for the US Dollar to preserve its recovery momentum and helps the pair rebound heading into the weekend.

GBP/USD steadies below 1.3400 as traders assess BoE policy outlook

Following Thursday's volatile session, GBP/USD moves sideways below 1.3400 on Friday. Investors reassess the Bank of England's policy oıtlook after the MPC decided to cut the interest rate by 25 bps by a slim margin. Meanwhile, the improving risk mood helps the pair hold its ground.

Gold stays below $4,350, looks to post small weekly gains

Gold struggles to gather recovery momentum and stays below $4,350 in the second half of the day on Friday, as the benchmark 10-year US Treasury bond yield edges higher. Nevertheless, the precious metal remains on track to end the week with modest gains as markets gear up for the holiday season.

Crypto Today: Bitcoin, Ethereum, XRP rebound amid bearish market conditions

Bitcoin (BTC) is edging higher, trading above $88,000 at the time of writing on Monday. Altcoins, including Ethereum (ETH) and Ripple (XRP), are following in BTC’s footsteps, experiencing relief rebounds following a volatile week.

How much can one month of soft inflation change the Fed’s mind?

One month of softer inflation data is rarely enough to shift Federal Reserve policy on its own, but in a market highly sensitive to every data point, even a single reading can reshape expectations. November’s inflation report offered a welcome sign of cooling price pressures. 

XRP rebounds amid ETF inflows and declining retail demand demand

XRP rebounds as bulls target a short-term breakout above $2.00 on Friday. XRP ETFs record the highest inflow since December 8, signaling growing institutional appetite.