GBP/USD Price Analysis: Fades Brexit deal-inspired upside momentum near 1. 2050


Share:
  • GBP/USD remains sidelined after rising the most in seven weeks.
  • UK PM Sunak manages to strike all-around acceptability with latest Brexit deal.
  • Sluggish oscillators probe traders around previous resistance line.
  • Key DMAs, support line challenge Cable bears despite snapping four-month uptrend in February.

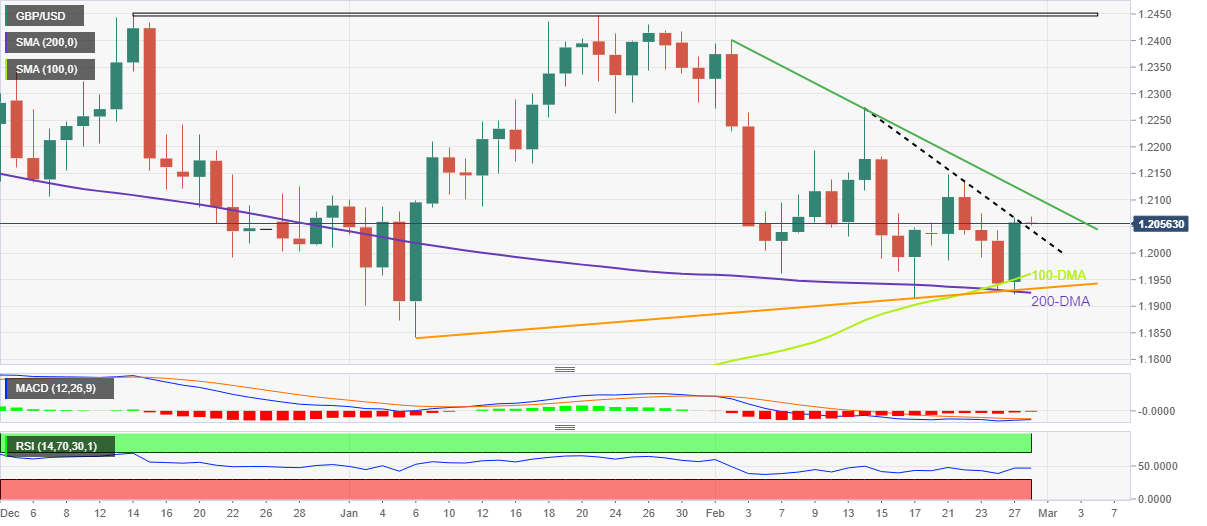
GBP/USD struggles to extend the Brexit deal-induced gains around 1.2050-60 during early Tuesday. Even so, the Cable pair defends the previous day’s rebound from the key technical levels while also keeping the upside break of a short-term key resistance line, now support.

It’s worth noting that the sluggish MACD and RSI conditions challenge the Cable pair buyers after the quote rose the most on a daily since early January. That said, the GBP/USD remains on the way to posting the first monthly loss in five.

On a different page, optimism surrounding UK Prime Minister Rishi Sunak’s Brexit deal keeps the GBP/USD buyers hopeful as most of the hard Brexiteers have so far praised the initial deal for the Northern Ireland Protocol (NIP) that needs UK Parliamentary approval.

Also read: UK PM Sunak: Found a way to end the uncertainty for Northern Ireland

Hence, recent inaction in the market pushes back the bearish bias surrounding the GBP/USD as it defends the previous day’s fundamental, as well as technical, catalysts that recalled the bulls on Monday.

As a result, the Cable pair is on the way to poking a downward-sloping resistance line from February 02, close to 1.2110 by the press time, unless it drops below the resistance-turned-support line near 1.2040.

Even if the quote drops below 1.2040, the 100-DMA and 200-DMA, respectively near 1.1960 and 1.1920, could challenge the GBP/USD bears. Also acting as a downside filter is an upward-sloping support line from early January, close to 1.1930 by the press time.

On the flip side, a successful break of the 1.2110 resistance line could propel the GBP/USD price toward the mid-February high surrounding 1.2270. However, the double tops marked near 1.2445-50 appear a tough nut to crack for the bulls afterward.

GBP/USD: Daily chart

Trend: Further upside expected

Additional important levels

Overview
Today last price 1.2058
Today Daily Change 0.0000
Today Daily Change % 0.00%
Today daily open 1.2058
 
Trends
Daily SMA20 1.2094
Daily SMA50 1.2147
Daily SMA100 1.1951
Daily SMA200 1.1928
 
Levels
Previous Daily High 1.2066
Previous Daily Low 1.1922
Previous Weekly High 1.2148
Previous Weekly Low 1.1928
Previous Monthly High 1.2448
Previous Monthly Low 1.1841
Daily Fibonacci 38.2% 1.2011
Daily Fibonacci 61.8% 1.1977
Daily Pivot Point S1 1.1965
Daily Pivot Point S2 1.1872
Daily Pivot Point S3 1.1821
Daily Pivot Point R1 1.2109
Daily Pivot Point R2 1.2159
Daily Pivot Point R3 1.2252


Share: Feed news

Information on these pages contains forward-looking statements that involve risks and uncertainties. Markets and instruments profiled on this page are for informational purposes only and should not in any way come across as a recommendation to buy or sell in these assets. You should do your own thorough research before making any investment decisions. FXStreet does not in any way guarantee that this information is free from mistakes, errors, or material misstatements. It also does not guarantee that this information is of a timely nature. Investing in Open Markets involves a great deal of risk, including the loss of all or a portion of your investment, as well as emotional distress. All risks, losses and costs associated with investing, including total loss of principal, are your responsibility. The views and opinions expressed in this article are those of the authors and do not necessarily reflect the official policy or position of FXStreet nor its advertisers. The author will not be held responsible for information that is found at the end of links posted on this page.

If not otherwise explicitly mentioned in the body of the article, at the time of writing, the author has no position in any stock mentioned in this article and no business relationship with any company mentioned. The author has not received compensation for writing this article, other than from FXStreet.

FXStreet and the author do not provide personalized recommendations. The author makes no representations as to the accuracy, completeness, or suitability of this information. FXStreet and the author will not be liable for any errors, omissions or any losses, injuries or damages arising from this information and its display or use. Errors and omissions excepted.

The author and FXStreet are not registered investment advisors and nothing in this article is intended to be investment advice.

Follow us on Telegram

Stay updated of all the news

Join Telegram

Recommended content


Follow us on Telegram

Stay updated of all the news

Join Telegram

Recommended content

Editors’ Picks

NZD/USD rallies to a fresh three-month top after RBNZ's hawkish pause

NZD/USD rallies to a fresh three-month top after RBNZ's hawkish pause

The NZD/USD pair gains strong follow-through positive traction on Wednesday and spikes to a fresh three-month peak after the RBNZ announced its policy decision. The central bank left its cash rate unchanged at 5.5% and reiterated that rates will need to remain at a restricted level for a sustained period of time. 

NZD/USD News

AUD/USD reacts little to softer headline Australian CPI, holds steady near multi-month peak

AUD/USD reacts little to softer headline Australian CPI, holds steady near multi-month peak

The AUD/USD ticks lower following the release of softer domestic consumer inflation figures. The data raises doubts over the possibility of a December rate hike from the RBA and acts as a headwind for the Aussie. Apart from this, the prevalent US Dollar selling bias helps limit the downside for the pair.

AUD/USD News

Gold rally extends into $2,040 as Fedspeak sparks Fed pivot bets

Gold rally extends into $2,040 as Fedspeak sparks Fed pivot bets

Gold price climbed on Tuesday in their best single-day performance in over six weeks, climbing 1.5% on the day and settling at a seven-month peak of $2,044. Markets saw a risk rally as investor sentiment bid up assets across the board, sparked by Dovish Fed comments that sent Gold climbing on the day.

Gold News

Up by 96% in a week, this altcoin is likely following Solana price rally from 2021

Up by 96% in a week, this altcoin is likely following Solana price rally from 2021

Solana was known as the “Ethereum killer” when it skyrocketed back in 2021; however, it did not manage to kill the DeFi home in any way. Similarly, many altcoins have since emerged that have been denoted as Solana killers, but hardly anyone has managed to do that.

Read more

Global growth outlook remains cloudy and grey

Global growth outlook remains cloudy and grey

Prospects for the global economy have dimmed slightly over the past month, with restrictive monetary policy set to weigh on growth prospects for next year. The forecast for global GDP growth in 2023 remains unchanged at 2.8%, while the forecast for 2024 global GDP growth has been revised slightly lower to 2.3%. 

Read more

Forex MAJORS

Cryptocurrencies

Signatures