EUR/USD Price Analysis: Remains above 1.0800, upper boundary of the descending channel
- EUR/USD may return to the descending channel pattern as bearish bias is still in play.
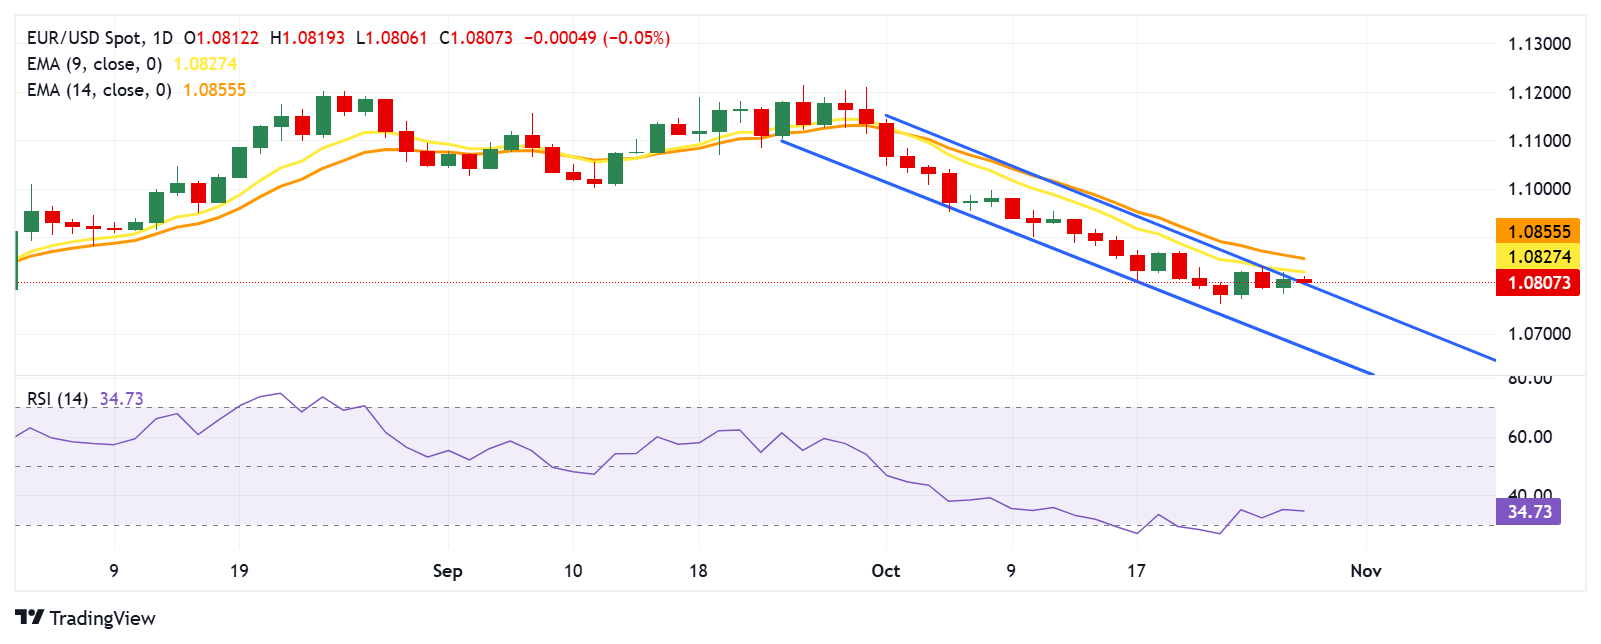
- The nine-day Exponential Moving Average (EMA) is below the 14-day EMA, suggesting an ongoing bearish bias for the pair.
- The pair finds support at a psychological level of 1.0800, aligned with the upper boundary of the descending channel.

EUR/USD retraces its recent gains from the previous session, trading around 1.0810 during the Asian hours on Tuesday. A review of the daily chart shows that the pair tests the upper boundary to return to the descending channel pattern. which could reinforce a bearish bias for the pair.
The 14-day Relative Strength Index (RSI), a key momentum indicator, is slightly above the 30 level. A drop below this threshold would indicate an oversold condition, suggesting the possibility of an upward correction for the EUR/USD pair in the near future.
Additionally, the nine-day Exponential Moving Average (EMA) is below the 14-day EMA, confirming the prevailing bearish trend in the EUR/USD pair’s price. The short-term price momentum is weaker, which could mean that the price is likely to continue experiencing downward pressure.
On the downside, the immediate support level appears to be at a psychological level of 1.0800, which coincides with the upper boundary of the descending channel. If the price falls back within this channel, it could increase the likelihood of a decline toward the psychological level of 1.0700.
A break below the 1.0700 level would likely heighten selling pressure, pushing the EUR/USD pair further down to test the lower boundary of the descending channel, estimated at around 1.0680.
In terms of resistance, the EUR/USD pair may encounter an immediate barrier around the nine-day Exponential Moving Average (EMA) at the 1.0826 level, followed by the 14-day EMA at the 1.0855 level. A breakthrough above these EMAs could lead the pair to approach the psychological level of 1.0900.
EUR/USD: Daily Chart
(This story was corrected on October 29 at 11:15 GMT to say that, if the price falls back within the descending channel, a decline toward the psychological level of 1.0700 is possible, not 1.0600.)
Euro PRICE Today
The table below shows the percentage change of Euro (EUR) against listed major currencies today. Euro was the weakest against the Japanese Yen.
| USD | EUR | GBP | JPY | CAD | AUD | NZD | CHF | |
|---|---|---|---|---|---|---|---|---|
| USD | 0.04% | 0.09% | -0.26% | 0.06% | 0.29% | 0.17% | -0.05% | |
| EUR | -0.04% | 0.04% | -0.31% | 0.02% | 0.25% | 0.12% | -0.06% | |
| GBP | -0.09% | -0.04% | -0.36% | -0.02% | 0.20% | 0.07% | -0.10% | |
| JPY | 0.26% | 0.31% | 0.36% | 0.33% | 0.56% | 0.41% | 0.26% | |
| CAD | -0.06% | -0.02% | 0.02% | -0.33% | 0.23% | 0.10% | -0.08% | |
| AUD | -0.29% | -0.25% | -0.20% | -0.56% | -0.23% | -0.12% | -0.34% | |
| NZD | -0.17% | -0.12% | -0.07% | -0.41% | -0.10% | 0.12% | -0.20% | |
| CHF | 0.05% | 0.06% | 0.10% | -0.26% | 0.08% | 0.34% | 0.20% |
The heat map shows percentage changes of major currencies against each other. The base currency is picked from the left column, while the quote currency is picked from the top row. For example, if you pick the Euro from the left column and move along the horizontal line to the US Dollar, the percentage change displayed in the box will represent EUR (base)/USD (quote).
Author

Akhtar Faruqui
FXStreet
Akhtar Faruqui is a Forex Analyst based in New Delhi, India. With a keen eye for market trends and a passion for dissecting complex financial dynamics, he is dedicated to delivering accurate and insightful Forex news and analysis.


