EUR/USD Price Analysis: Pullback remains elusive beyond golden ratio around 0.9950


  • EUR/USD retreats towards intraday low during two-week uptrend, mildly bid after falling the most in three weeks.
  • Clear downside break of weekly bullish channel directs bears towards 200-SMA.
  • Fresh upside needs validation from 1.0040 before aiming for September’s top.

EUR/USD pares the consecutive second weekly gain as it slides to 0.9970 heading into Friday’s European session.

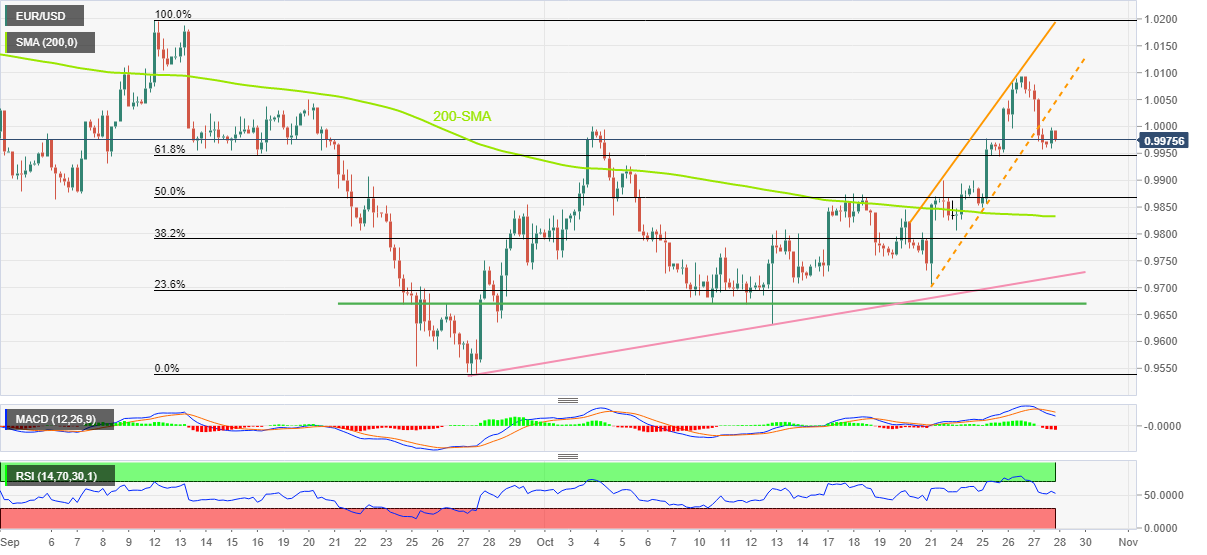
In doing so, the major currency pair justifies the previous day’s downside break of a one-week-old bullish channel to direct bears toward the 61.8% Fibonacci retracement level of the quote’s fall in September.

It’s worth noting that the bearish MACD and mostly steady RSI (14) keep the sellers hopeful of breaking the immediate Fibonacci retracement level, also known as the golden ratio near 0.9950, which in turn could direct prices towards the 50% Fibonacci retracement level of 0.9870. However, the 200-SMA level surrounding 0.9830 could challenge the EUR/USD bears afterward.

In a case where the quote remains weak past 0.9830, a one-month-old ascending trend line precedes the five-week-long horizontal region to challenge the pair’s further downside around 0.9720 and 0.9670 in that order.

Meanwhile, recovery moves need to cross the previous support line of the aforementioned channel, around 1.0050 at the latest.

Even so, the monthly high near 1.0095 and the 1.0100 threshold could test the EUR/USD bulls before directing them to the previous monthly peak of 1.0198.

EUR/USD: Four-hour chart

Trend: Limited downside expected

Additional important levels

Overview
Today last price 0.9974
Today Daily Change 0.0009
Today Daily Change % 0.09%
Today daily open 0.9965
 
Trends
Daily SMA20 0.9832
Daily SMA50 0.9891
Daily SMA100 1.0088
Daily SMA200 1.0511
 
Levels
Previous Daily High 1.0094
Previous Daily Low 0.9958
Previous Weekly High 0.9876
Previous Weekly Low 0.9705
Previous Monthly High 1.0198
Previous Monthly Low 0.9536
Daily Fibonacci 38.2% 1.001
Daily Fibonacci 61.8% 1.0042
Daily Pivot Point S1 0.9917
Daily Pivot Point S2 0.9869
Daily Pivot Point S3 0.9781
Daily Pivot Point R1 1.0053
Daily Pivot Point R2 1.0142
Daily Pivot Point R3 1.0189


Share: Feed news

Information on these pages contains forward-looking statements that involve risks and uncertainties. Markets and instruments profiled on this page are for informational purposes only and should not in any way come across as a recommendation to buy or sell in these assets. You should do your own thorough research before making any investment decisions. FXStreet does not in any way guarantee that this information is free from mistakes, errors, or material misstatements. It also does not guarantee that this information is of a timely nature. Investing in Open Markets involves a great deal of risk, including the loss of all or a portion of your investment, as well as emotional distress. All risks, losses and costs associated with investing, including total loss of principal, are your responsibility. The views and opinions expressed in this article are those of the authors and do not necessarily reflect the official policy or position of FXStreet nor its advertisers. The author will not be held responsible for information that is found at the end of links posted on this page.

If not otherwise explicitly mentioned in the body of the article, at the time of writing, the author has no position in any stock mentioned in this article and no business relationship with any company mentioned. The author has not received compensation for writing this article, other than from FXStreet.

FXStreet and the author do not provide personalized recommendations. The author makes no representations as to the accuracy, completeness, or suitability of this information. FXStreet and the author will not be liable for any errors, omissions or any losses, injuries or damages arising from this information and its display or use. Errors and omissions excepted.

The author and FXStreet are not registered investment advisors and nothing in this article is intended to be investment advice.

Recommended content


Recommended content

Editors’ Picks

EUR/USD clings to modest gains above 1.0650 ahead of US data

EUR/USD clings to modest gains above 1.0650 ahead of US data

EUR/USD trades modestly higher on the day above 1.0650 in the early American session on Tuesday. The upbeat PMI reports from the Eurozone and Germany support the Euro as market focus shift to US PMI data.

EUR/USD News

GBP/USD extends rebound, tests 1.2400

GBP/USD extends rebound, tests 1.2400

GBP/USD preserves its recovery momentum and trades near 1.2400 in the second half of the day on Tuesday. The data from the UK showed that the private sector continued to grow at an accelerating pace in April, helping Pound Sterling gather strength against its rivals.

GBP/USD News

Gold flirts with $2,300 amid receding safe-haven demand

Gold flirts with $2,300 amid receding safe-haven demand

Gold (XAU/USD) remains under heavy selling pressure for the second straight day on Tuesday and languishes near its lowest level in over two weeks, around the $2,300 mark in the European session. Eyes on US PMI data. 

Gold News

Here’s why Ondo price hit new ATH amid bearish market outlook Premium

Here’s why Ondo price hit new ATH amid bearish market outlook

Ondo price shows no signs of slowing down after setting up an all-time high (ATH) at $1.05 on March 31. This development is likely to be followed by a correction and ATH but not necessarily in that order.

Read more

US S&P Global PMIs Preview: Economic expansion set to keep momentum in April

US S&P Global PMIs Preview: Economic expansion set to keep momentum in April

S&P Global Manufacturing PMI and Services PMI are both expected to come in at 52 in April’s flash estimate, highlighting an ongoing expansion in the private sector’s economic activity.

Read more

Forex MAJORS

Cryptocurrencies

Signatures