|

EUR/USD Price Analysis: Extends recovery above 1.0660 as investors’ risk-taking capacity improves

  • EUR/USD has rebounded above 1.0660 as the risk appetite of the market participants has improved.
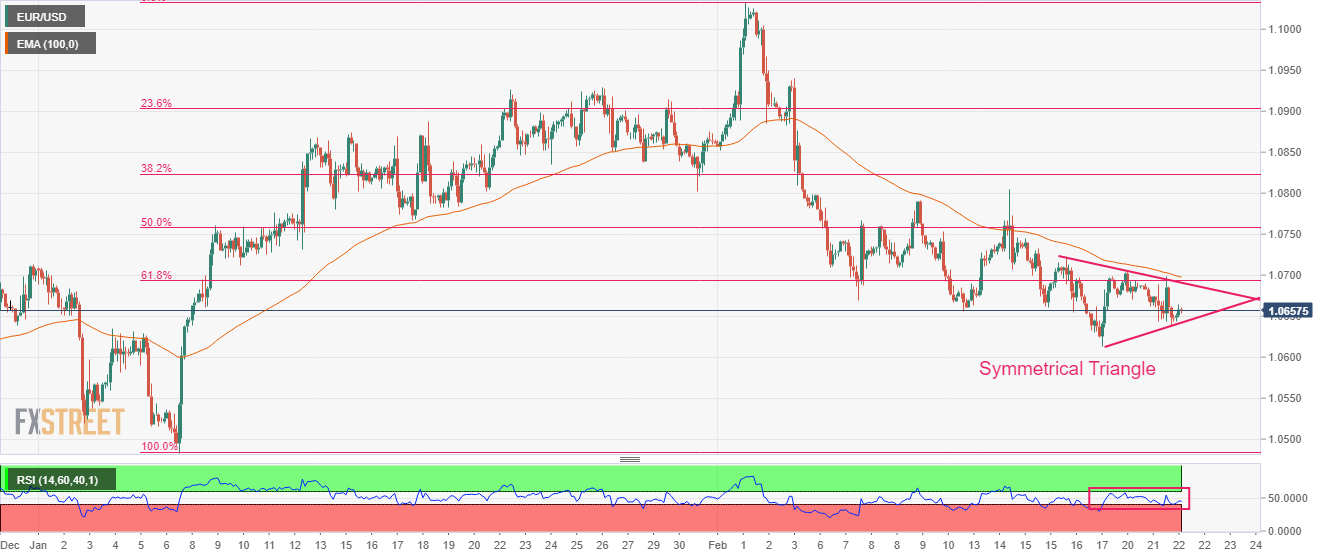
  • The formation of the Symmetrical Triangle below the 61.8% Fibo retracement is indicating a volatility contraction.
  • ECB Lagarde has confirmed the continuation of the 50 bps interest rate hike ahead.

The EUR/USD pair has sensed a buying interest after dropping to near 1.0640 in the Asian session. The major currency pair has rebounded as the risk appetite of the market participants has improved. The US Dollar Index (DXY) is struggling to recover after a corrective move amid a rebound in the risk-on mood, however, it would be early considering the positive risk impulse extremely solid as investors are awaiting the release of the Federal Open Market Committee (FOMC) minutes.

S&P500 futures have some decent gains in the Asian session after an intense sell-off on Tuesday. Long weekend-inspired volatility and upbeat preliminary United States S&P PMI figures were sufficient to force investors to dump US stocks.

On the Eurozone front, European Central Bank (ECB) President Christine Lagarde clearly announced “Headline inflation has begun to slowdown but reiterated that they intend to raise the key rates by 50 basis points (bps) at the upcoming policy meeting. She also cited that the central bank is not seeing a wage-price spiral in the Eurozone.

EUR/USD is continuously facing barricades around the 61.8% Fibonacci retracement (placed from January 6 low at 1.0483 to February high at 1.1033) at 1.0693. The formation of the Symmetrical Triangle chart pattern is indicating a volatility contraction in the asset.

The 100-period Exponential Moving Average (EMA) at around 1.0700 will continue to act as a major barricade for the Euro bulls.

Meanwhile, the Relative Strength Index (RSI) (14) is on the verge of slipping into the bearish range of 20.00-40.00. An occurrence of the same will trigger a downside momentum.

A decisive downside move below February 17 low at 1.0613 will drag the asset toward December 22 low at 1.0573. A slippage below the latter will extend the downside toward January 6 low at 1.0483.

In an alternate scenario, a break above February 16 high at 1.0722 will drive the asset toward 50% Fibo retracement at 1.0758, followed by February 14 high around 1.0800.

EUR/USD two-hour chart

EUR/USD

Overview
Today last price1.0656
Today Daily Change0.0010
Today Daily Change %0.09
Today daily open1.0646
 
Trends
Daily SMA201.0776
Daily SMA501.0729
Daily SMA1001.0427
Daily SMA2001.0331
 
Levels
Previous Daily High1.0698
Previous Daily Low1.0638
Previous Weekly High1.0805
Previous Weekly Low1.0613
Previous Monthly High1.093
Previous Monthly Low1.0483
Daily Fibonacci 38.2%1.0661
Daily Fibonacci 61.8%1.0675
Daily Pivot Point S11.0623
Daily Pivot Point S21.06
Daily Pivot Point S31.0562
Daily Pivot Point R11.0683
Daily Pivot Point R21.0721
Daily Pivot Point R31.0744

Author

Sagar Dua

Sagar Dua

FXStreet

Sagar Dua is associated with the financial markets from his college days. Along with pursuing post-graduation in Commerce in 2014, he started his markets training with chart analysis.

More from Sagar Dua
Share:

Editor's Picks

GBP/USD appears well offered near 1.3160

GBP/USD builds on Tuesday’s losses, although it now manages to pick up some pace and bounce off earlier multi-month troughs near 1.3140. The Greenback’s solid performance and continued political turmoil in the UK are keeping Cable under persistent pressure, with little sign of a meaningful recovery.

EUR/USD rebounds from lows, back to 1.1360

After bottoming out near 1.1320, EUR/USD gathers some traction and reclaims the 1.1350-1.1360 band as the NA session draws to a close on Wednesday. The pair’s drop to multi-month lows comes in response to the continuous leg higher in the US Dollar, which remains propped up by hawkish Fed expectations and uncertainty over the outcome of US-Iran peace negotiations.

Gold pressured near fresh 2026 lows

Gold accelerates its decline and gyrates around the key $4,000 mark per troy ounce on Wednesday, its lowest level since November 2025. In the meantime, tighter-for-longer Fed expectations and a broadly firmer US Dollar continue to weigh on the yellow metal, while uncertainty surrounding a potential US-Iran peace agreement has done little to revive demand for the safe haven space.

XRP nears key support as Fed hike risks suppress demand
Ripple (XRP) continues to face significant selling pressure, trading around $1.05 at the time of writing on Wednesday. This decline mirrors the broader weakness in the crypto market, exacerbated by mounting macroeconomic headwinds and persistent geopolitical uncertainties.
US-Iran talks: The next 60 days will decide where Oil prices go next
Oil markets received some encouraging news after weeks of rising tensions in the Middle East. But let’s not get ahead of ourselves: we’re far from victory, and markets just seem to have priced out the worst-case scenario. The US and Iran have reportedly made "substantive progress" in talks in Switzerland and agreed on a framework for working toward a broader deal within 60 days.
Regime change: Inside Kevin Warsh's first move to make the Fed unreadable on purpose

The rate did not move. That was the least interesting thing about Kevin Warsh's first meeting in charge of the Fed. The FOMC held its benchmark at 3.50%-3.75% for the fourth straight meeting, exactly as priced, and then the new chair used his first press conference to dismantle the machinery the market has leaned on for a decade.