EUR/GBP Price Analysis: Key EMA confluence prods bulls around 0.8820 hurdle


  • EUR/GBP retreats from the key EMA convergence after rising the most in three months.
  • Steady RSI, easing bearish MACD signals keep buyers hopeful backed by a clear upside break of two-week-old trend line.
  • 200-EMA, 61.8% Fibonacci retracement constitutes strong support to challenge bears.


EUR/GBP treads water around 0.8810-15, after rising the most in three months, as it braces for the key UK data/events during early Wednesday.

In doing so, the cross-currency pair retreats from the convergence of the 21-day and 50-day Exponential Moving Average (EMA).

However, the recent easing in the bearish bias of the MACD signals and steady RSI joins the EUR/GBP pair’s successful break of a two-week-old descending trend line to keep the buyers hopeful of crossing the 0.8820 resistance confluence.

Following that, a run-up towards the 0.8900 round figure can’t be ruled out.

However, a downward-sloping resistance line from mid-February, around 0.8920 by the press time, could challenge the EUR/GBP bulls afterward.

On the contrary, pullback moves gain importance only on breaking the previous resistance line, around 0.8765 at the latest.

Even so, a convergence of the 200-EMA and 61.8% Fibonacci retracement level of the EUR/GBP pair’s run-up from December 2022 to February 2023, around 0.8710, appears a tough nut to crack for the pair sellers.

To sum up, EUR/GBP is likely to grind higher but the upside momentum had multiple hurdles to crack.

EUR/GBP: Daily chart

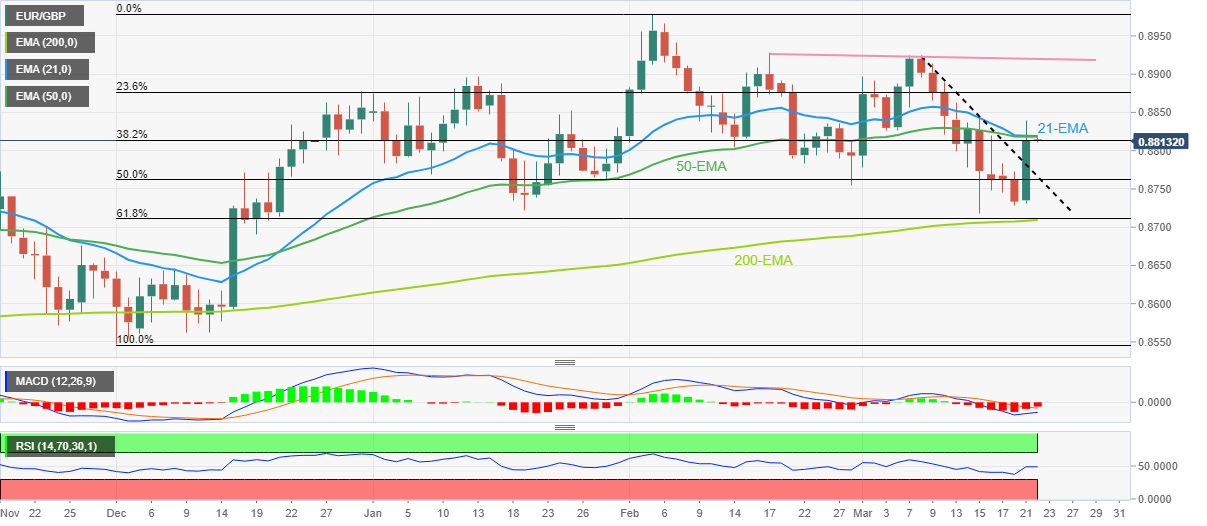
Trend: Further upside expected

Additional important levels

Overview
Today last price 0.8813
Today Daily Change 0.0080
Today Daily Change % 0.92%
Today daily open 0.8733
 
Trends
Daily SMA20 0.8826
Daily SMA50 0.8836
Daily SMA100 0.8773
Daily SMA200 0.8685
 
Levels
Previous Daily High 0.8773
Previous Daily Low 0.8728
Previous Weekly High 0.8864
Previous Weekly Low 0.8718
Previous Monthly High 0.8979
Previous Monthly Low 0.8755
Daily Fibonacci 38.2% 0.8745
Daily Fibonacci 61.8% 0.8756
Daily Pivot Point S1 0.8717
Daily Pivot Point S2 0.87
Daily Pivot Point S3 0.8672
Daily Pivot Point R1 0.8761
Daily Pivot Point R2 0.8789
Daily Pivot Point R3 0.8806


Share: Feed news

Information on these pages contains forward-looking statements that involve risks and uncertainties. Markets and instruments profiled on this page are for informational purposes only and should not in any way come across as a recommendation to buy or sell in these assets. You should do your own thorough research before making any investment decisions. FXStreet does not in any way guarantee that this information is free from mistakes, errors, or material misstatements. It also does not guarantee that this information is of a timely nature. Investing in Open Markets involves a great deal of risk, including the loss of all or a portion of your investment, as well as emotional distress. All risks, losses and costs associated with investing, including total loss of principal, are your responsibility. The views and opinions expressed in this article are those of the authors and do not necessarily reflect the official policy or position of FXStreet nor its advertisers. The author will not be held responsible for information that is found at the end of links posted on this page.

If not otherwise explicitly mentioned in the body of the article, at the time of writing, the author has no position in any stock mentioned in this article and no business relationship with any company mentioned. The author has not received compensation for writing this article, other than from FXStreet.

FXStreet and the author do not provide personalized recommendations. The author makes no representations as to the accuracy, completeness, or suitability of this information. FXStreet and the author will not be liable for any errors, omissions or any losses, injuries or damages arising from this information and its display or use. Errors and omissions excepted.

The author and FXStreet are not registered investment advisors and nothing in this article is intended to be investment advice.

Recommended content


Recommended content

Editors’ Picks

EUR/USD clings to daily gains above 1.0650

EUR/USD clings to daily gains above 1.0650

EUR/USD gained traction and turned positive on the day above 1.0650. The improvement seen in risk mood following the earlier flight to safety weighs on the US Dollar ahead of the weekend and helps the pair push higher.

EUR/USD News

GBP/USD recovers toward 1.2450 after UK Retail Sales data

GBP/USD recovers toward 1.2450 after UK Retail Sales data

GBP/USD reversed its direction and advanced to the 1.2450 area after touching a fresh multi-month low below 1.2400 in the Asian session. The positive shift seen in risk mood on easing fears over a deepening Iran-Israel conflict supports the pair.

GBP/USD News

Gold holds steady at around $2,380 following earlier spike

Gold holds steady at around $2,380 following earlier spike

Gold stabilized near $2,380 after spiking above $2,400 with the immediate reaction to reports of Israel striking Iran. Meanwhile, the pullback seen in the US Treasury bond yields helps XAU/USD hold its ground.

Gold News

Bitcoin Weekly Forecast: BTC post-halving rally could be partially priced in Premium

Bitcoin Weekly Forecast: BTC post-halving rally could be partially priced in

Bitcoin price shows no signs of directional bias while it holds above  $60,000. The fourth BTC halving is partially priced in, according to Deutsche Bank’s research. 

Read more

Week ahead – US GDP and BoJ decision on top of next week’s agenda

Week ahead – US GDP and BoJ decision on top of next week’s agenda

US GDP, core PCE and PMIs the next tests for the Dollar. Investors await BoJ for guidance about next rate hike. EU and UK PMIs, as well as Australian CPIs also on tap.

Read more

Forex MAJORS

Cryptocurrencies

Signatures