Dow Jones Industrial Average soars 450 points on Fed-heavy Friday
- The Dow Jones rallied to 41,200.00 after Fed officials agreed its time to cut rates.
- Equities have immediately moved on to guessing how many rate cuts in 2024.
- Rate markets see 100 bps in cuts by 2024 year-end.

The Dow Jones Industrial Average (DJIA) lurched over 400 points higher on Friday after the Federal Reserve (Fed) gave a nod of the head to upcoming rate cuts. Several Fed policymakers appeared before markets to signal a long-awaited shift in policy stance that markets have been rallying for since at least last December, when investors had initially priced in an eye-watering six rate cuts for over 200 bps by the end of 2024.
Read more: Jerome Powell repeats timing and pace of rate cuts will depend on data
Fast-forward to late August, and traders are now grappling with whether or not the Fed’s September rate call will be for 25 or 50 bps. According to the CME’s FedWatch Tool, rate markets are pricing in roughly three-to-one odds of a double cut on September 18, with the rest of the rate board still committed to a single quarter-point cut. Bets of a 50 bps opening rate trim in September rose after Fed Chairman Jerome Powell, while speaking at the Jackson Hole Economic Symposium on Friday, openly admitted that the time has finally come for the US central bank to begin pushing reference rates down.
Dow Jones news
It took a bit of time, but the Dow Jones eventually hammer bids across the board, dragging all but two of the index's constituent securities into the green on Friday. Procter & Gamble Co. remained in the red, falling nearly -0.6% and slipping below $170.00 per share after it was revealed that stock insider and company COO Shailesh Jejurikar sold over 10,000 share, or nearly a third of his stake in the company.
Read more Dow Jones news:
Intel sinks 6% as German factory investment becomes less certain
Goldman Sachs advances on heat from Powell’s speech in Jackson Hole
Dow Jones price forecast
The Dow Jones managed to tap 41,200.00 for the first time since late July amidst a broad rally in equities. With the index continuing to test higher ground, the DJIA is on pace to again challenge all-time highs priced in at 41,371.38 set in mid-July.
Despite a firm bullish stance, bidders are at risk of running out of momentum with price action strung along the high side. The Dow Jones continues to trade well above the 200-day Exponential Moving Average (EMA) at 38,187.93, and a near-term pullback will see the Dow Jones skid back into the 50-day EMA rising into the 40,000.00 major price handle.
Dow Jones daily chart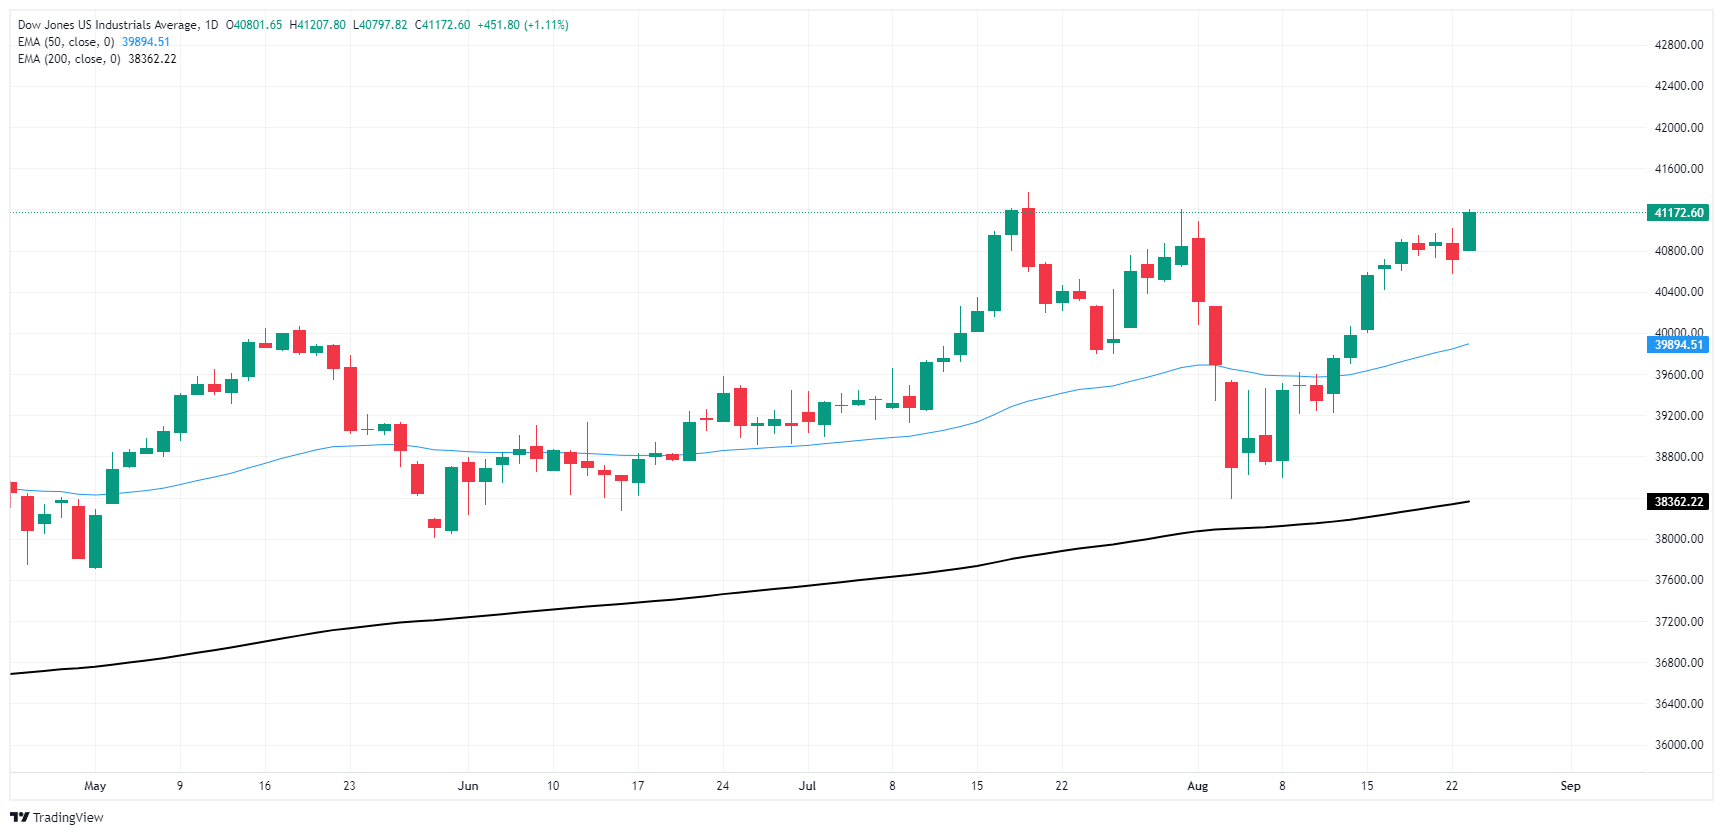
Dow Jones FAQs
The Dow Jones Industrial Average, one of the oldest stock market indices in the world, is compiled of the 30 most traded stocks in the US. The index is price-weighted rather than weighted by capitalization. It is calculated by summing the prices of the constituent stocks and dividing them by a factor, currently 0.152. The index was founded by Charles Dow, who also founded the Wall Street Journal. In later years it has been criticized for not being broadly representative enough because it only tracks 30 conglomerates, unlike broader indices such as the S&P 500.
Many different factors drive the Dow Jones Industrial Average (DJIA). The aggregate performance of the component companies revealed in quarterly company earnings reports is the main one. US and global macroeconomic data also contributes as it impacts on investor sentiment. The level of interest rates, set by the Federal Reserve (Fed), also influences the DJIA as it affects the cost of credit, on which many corporations are heavily reliant. Therefore, inflation can be a major driver as well as other metrics which impact the Fed decisions.
Dow Theory is a method for identifying the primary trend of the stock market developed by Charles Dow. A key step is to compare the direction of the Dow Jones Industrial Average (DJIA) and the Dow Jones Transportation Average (DJTA) and only follow trends where both are moving in the same direction. Volume is a confirmatory criteria. The theory uses elements of peak and trough analysis. Dow’s theory posits three trend phases: accumulation, when smart money starts buying or selling; public participation, when the wider public joins in; and distribution, when the smart money exits.
There are a number of ways to trade the DJIA. One is to use ETFs which allow investors to trade the DJIA as a single security, rather than having to buy shares in all 30 constituent companies. A leading example is the SPDR Dow Jones Industrial Average ETF (DIA). DJIA futures contracts enable traders to speculate on the future value of the index and Options provide the right, but not the obligation, to buy or sell the index at a predetermined price in the future. Mutual funds enable investors to buy a share of a diversified portfolio of DJIA stocks thus providing exposure to the overall index.
Author

Joshua Gibson
FXStreet
Joshua joins the FXStreet team as an Economics and Finance double major from Vancouver Island University with twelve years' experience as an independent trader focusing on technical analysis.


![Hyperliquid representatives, Trade[XYZ] meet SEC Crypto Task Force to discuss digital asset regulation](https://editorial.fxsstatic.com/images/i/Hyperliquid_Bull.png)


