Intel sinks 6% as German factory investment becomes less certain

Intel stock dipped over 6% on Thursday after the market grew even more pessimistic over the chip giant’s plans for a new factory in Magdeburg, Germany. INTC shares shed 6.1% to close at $20.10 per share.
Intel’s slump helped the Dow Jones Industrial Average lose 0.43% on the day, though other indices fared much worse. The S&P 500 lost 0.89%, while the NASDAQ compressed 1.67%.
Traders seem a wee bit anxious ahead of Federal Reserve Chair Jerome Powell’s speech at the Jackson Hole Symposium on Friday. The Chair is expected to provide concrete evidence of the central bank’s game plan for cutting interest rates at the final three FOMC meetings left this year.
Intel stock news
Intel stock has been facing the wrath of shareholders all year after cutting its dividend in an attempt to re-enter the third-party chip fabrication end of the business. As part of CEO Pat Gelsinger’s turnaround plan, Intel has been set to receive $11 billion in subsidies to cover construction costs on two new fabs outside Magdeburg. The German subsidy was slated to cover about one-third of Intel’s capex on the project.
However, a story in Fortune magazine went live on Thursday that threw the entire project into doubt. Intel is in the midst of a hefty cost-cutting strategy, and observers think the Germany plan might be scrapped.
Originally, Intel's German production operation was scheduled to be up and running in 2027, but now that timeline appears too rosy to insiders.
Additionally, Intel’s primary competitor in third-party fabrication, Taiwan Semiconductor (TSM), simultaneously announced that the European Union would foot the bill for half of its costs on a separate new factory on the continent.
What’s more, Intel board member Lip-Bu Tan, the former CEO of Cadence Design Systems, chose this moment to leave the board. Many are taking this as yet another sign of weakness at the once great Intel. The company recently announced that it is reducing its workforce by 15%.
Dow Jones FAQs
The Dow Jones Industrial Average, one of the oldest stock market indices in the world, is compiled of the 30 most traded stocks in the US. The index is price-weighted rather than weighted by capitalization. It is calculated by summing the prices of the constituent stocks and dividing them by a factor, currently 0.152. The index was founded by Charles Dow, who also founded the Wall Street Journal. In later years it has been criticized for not being broadly representative enough because it only tracks 30 conglomerates, unlike broader indices such as the S&P 500.
Many different factors drive the Dow Jones Industrial Average (DJIA). The aggregate performance of the component companies revealed in quarterly company earnings reports is the main one. US and global macroeconomic data also contributes as it impacts on investor sentiment. The level of interest rates, set by the Federal Reserve (Fed), also influences the DJIA as it affects the cost of credit, on which many corporations are heavily reliant. Therefore, inflation can be a major driver as well as other metrics which impact the Fed decisions.
Dow Theory is a method for identifying the primary trend of the stock market developed by Charles Dow. A key step is to compare the direction of the Dow Jones Industrial Average (DJIA) and the Dow Jones Transportation Average (DJTA) and only follow trends where both are moving in the same direction. Volume is a confirmatory criteria. The theory uses elements of peak and trough analysis. Dow’s theory posits three trend phases: accumulation, when smart money starts buying or selling; public participation, when the wider public joins in; and distribution, when the smart money exits.
There are a number of ways to trade the DJIA. One is to use ETFs which allow investors to trade the DJIA as a single security, rather than having to buy shares in all 30 constituent companies. A leading example is the SPDR Dow Jones Industrial Average ETF (DIA). DJIA futures contracts enable traders to speculate on the future value of the index and Options provide the right, but not the obligation, to buy or sell the index at a predetermined price in the future. Mutual funds enable investors to buy a share of a diversified portfolio of DJIA stocks thus providing exposure to the overall index.
Intel stock chart
Intel stock is now trading at a level it last touched in 2012. Undoubtedly, this is one of the worst periods for the stock this century.
The monthly chart below that INTC has long-term support further down at $19.20. This area provided plenty of support during the year and a half between April 2011 and November 2012.
Intel stock won't be out of the grinder until it first overtakes the $24.90 prior support and then rises above the psychological $30.00 level.
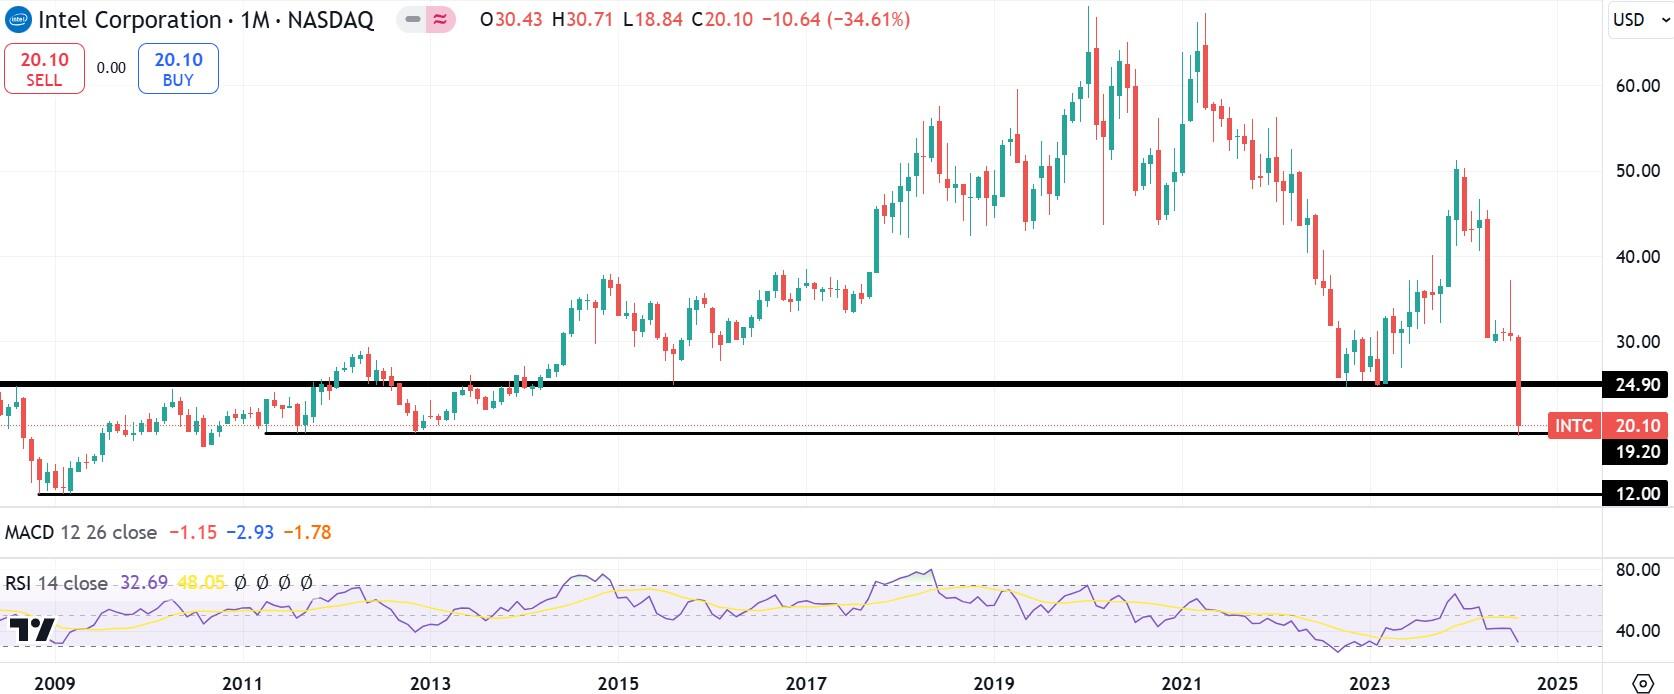
INTC monthly stock chart
Author

Clay Webster
FXStreet
Clay Webster grew up in the US outside Buffalo, New York and Lancaster, Pennsylvania. He began investing after college following the 2008 financial crisis.


