Dow Jones Industrial Average accelerates into the low end on Monday
- The Dow Jones shed 400 points to kick off the new trading week.
- Equities are pulling back in the face of lower rate cut expectations.
- Middle East geopolitical tensions are driving risk appetite even lower.

The Dow Jones Industrial Average (DJIA) shed around 400 points on a shaky market Monday, with risk appetite shriveling on the back of decreased rate cut expectations and tensions in the Middle East running on the hot side. Markets expect less than 50 bps in further rate cuts from the Federal Reserve (Fed) for the remainder of the year. Crude Oil prices are rising as commodity traders brace for a spat between Iran and Israel to widen into an outright conflict.
Equities took a hit at the outset of a new trading week, waylaid by crumpling investor hopes for further outsized rate cuts from the Fed through the rest of 2024. According to the CME’s FedWatch Tool, rate traders now expect roughly an 80% chance of a single 25 bps rate trim from the Fed in November. The remaining roughly 20% expect the Fed to stand pat on November 7.
Markets are bracing for an escalation in the newly-sparked conflict between Iran and Israel; commodity investors are worried that Israel is set to lash out at Iran and strike Iran’s Crude Oil industry, a move that could send global energy prices soaring. Iran represents roughly 4% of global Crude Oil production. Israel is expected to deliver some kind of retaliatory attack against Iran, which launched a missile strike against Israel last week in retaliation for Israel invading neighboring Lebanon.
Dow Jones news
A risk-off Monday is weighing down equities across the board, with all but three of the DJIA’s constituent securities dipping into the red for the day. Chevron (CVX) rose one-third of one percent, as the fuels provider benefits from rapidly-accelerating Crude Oil prices. Chevron stock climbed over $151 per share.
Insurance provider Travelers Companies (TRV) outran the rest of the Dow Jones losers, tumbling nearly 5% to fall below $225 per share. Despite the headline hit on Travelers Companies, the insurance issuer is doing very well for itself, climbing over 55% from a late 2019 low of $99.35.
Dow Jones price forecast
Price action on the Dow Jones chart suggests a generally bullish sentiment since May, with the index consistently trading above its 50-day Exponential Moving Average (EMA), indicating that short-term momentum remains strong. The 200-day EMA serves as a significant support level, with the index maintaining a comfortable distance from it, reinforcing the underlying strength of the broader uptrend.
However, more recent sessions show a mild pullback. The DJIA faces resistance at around the 42,300 level, which has acted as a psychological barrier since mid-September. The downward price movement from this resistance, combined with a decline in momentum, is something to monitor closely. The MACD histogram has shifted into the negative zone, while the MACD line has crossed below the signal line, both of which are bearish signals, suggesting that short-term momentum may be slowing down.
Dow Jones daily chart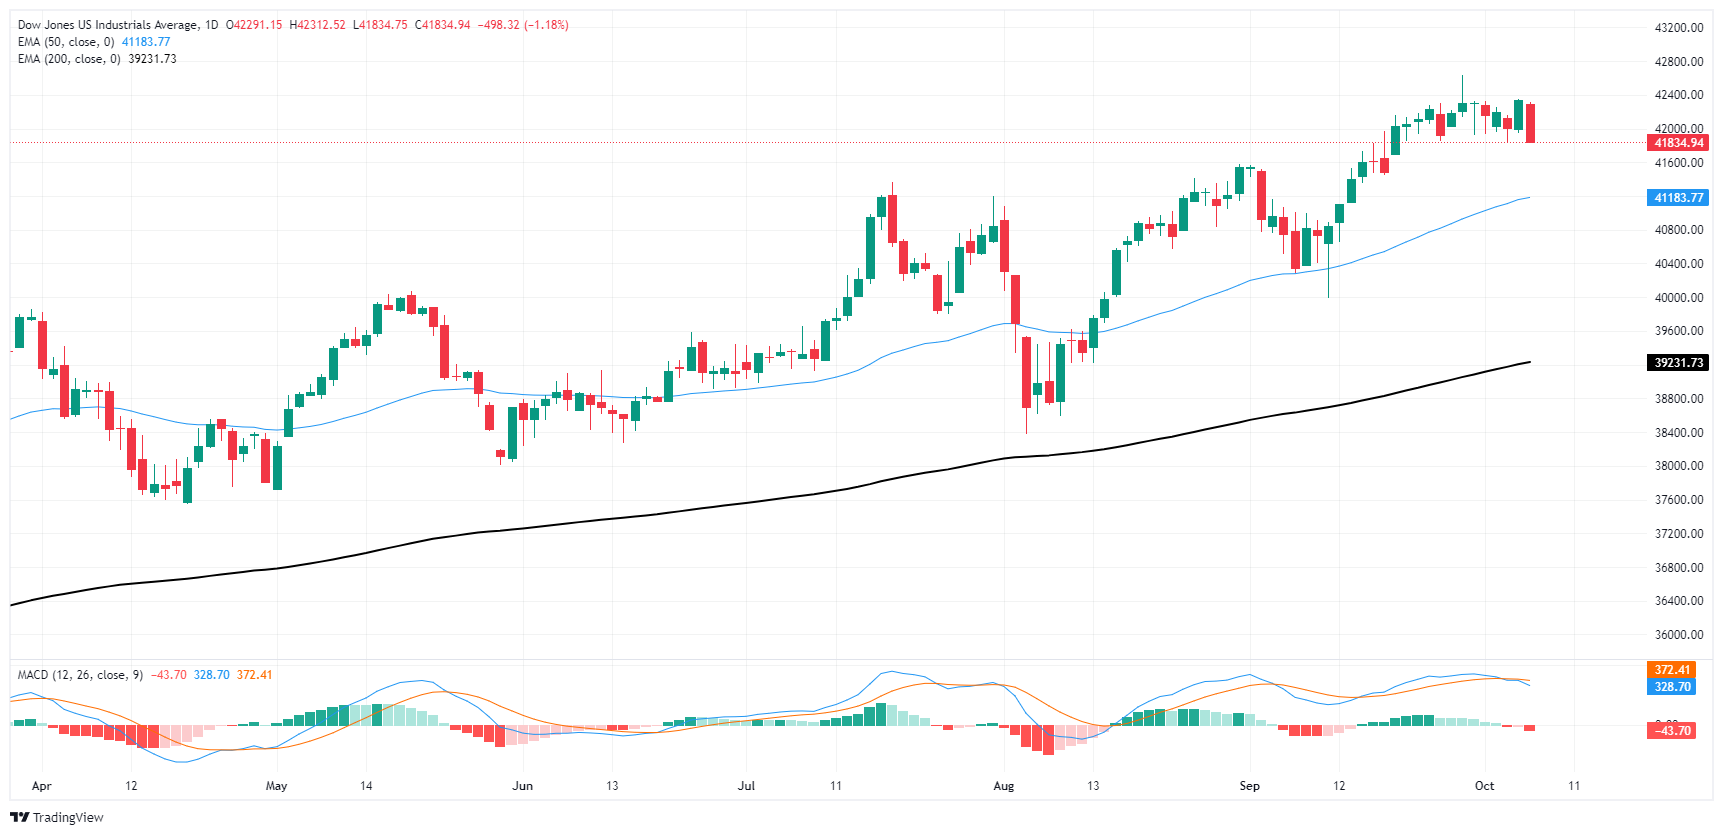
Dow Jones FAQs
The Dow Jones Industrial Average, one of the oldest stock market indices in the world, is compiled of the 30 most traded stocks in the US. The index is price-weighted rather than weighted by capitalization. It is calculated by summing the prices of the constituent stocks and dividing them by a factor, currently 0.152. The index was founded by Charles Dow, who also founded the Wall Street Journal. In later years it has been criticized for not being broadly representative enough because it only tracks 30 conglomerates, unlike broader indices such as the S&P 500.
Many different factors drive the Dow Jones Industrial Average (DJIA). The aggregate performance of the component companies revealed in quarterly company earnings reports is the main one. US and global macroeconomic data also contributes as it impacts on investor sentiment. The level of interest rates, set by the Federal Reserve (Fed), also influences the DJIA as it affects the cost of credit, on which many corporations are heavily reliant. Therefore, inflation can be a major driver as well as other metrics which impact the Fed decisions.
Dow Theory is a method for identifying the primary trend of the stock market developed by Charles Dow. A key step is to compare the direction of the Dow Jones Industrial Average (DJIA) and the Dow Jones Transportation Average (DJTA) and only follow trends where both are moving in the same direction. Volume is a confirmatory criteria. The theory uses elements of peak and trough analysis. Dow’s theory posits three trend phases: accumulation, when smart money starts buying or selling; public participation, when the wider public joins in; and distribution, when the smart money exits.
There are a number of ways to trade the DJIA. One is to use ETFs which allow investors to trade the DJIA as a single security, rather than having to buy shares in all 30 constituent companies. A leading example is the SPDR Dow Jones Industrial Average ETF (DIA). DJIA futures contracts enable traders to speculate on the future value of the index and Options provide the right, but not the obligation, to buy or sell the index at a predetermined price in the future. Mutual funds enable investors to buy a share of a diversified portfolio of DJIA stocks thus providing exposure to the overall index.
Author

Joshua Gibson
FXStreet
Joshua joins the FXStreet team as an Economics and Finance double major from Vancouver Island University with twelve years' experience as an independent trader focusing on technical analysis.


